The 'MEDIUM' Budget in CBAT is equal to the UKMO model-run and resulting 'Carbon-Budget' [2016 4% Low] in the UK Climate Act [UKCA].
Users can easily demonstrate this using the on/off 'toggle-switch' marked 'UKCA' on-screen top-right hand corner.
~~~~~~~~~~~~~~~~~~~~~~~~~~~~~~~~~~~~~~~~~~~
5 Relevant Points about the UK Climate Act [UKCA] based on the Climate-Modelling from the UK Meteorological Office [UKMO].
The weight/rate/date details for Emissions-Budget 2016 4% Low in UKCA
13 level array of Budget-Fractions Retained/Returned
Budget weight/rate/date adusted 13 times so each equals Median Concentration curve
Convergence date of 2050 acceleration shown for negotiation purposes
Arbitrary 'Bulge & Trend' shown in UKCA concentration curve array.
The main issues are that [a] UKMO failed to included key feedback-effects in this modle and [b] the UKCA completely fails to distinguish between 'Budget-Emissions' and the 'Feedback Emissions' that are recognized.
~~~~~~~~~~~~~~~~~~~~~~~~~~~~~~~~~~~~~~~~~~~
The UK Climate Act
A high-resolution TIFF file of this image is Here
Quick view PDF version of this image Here
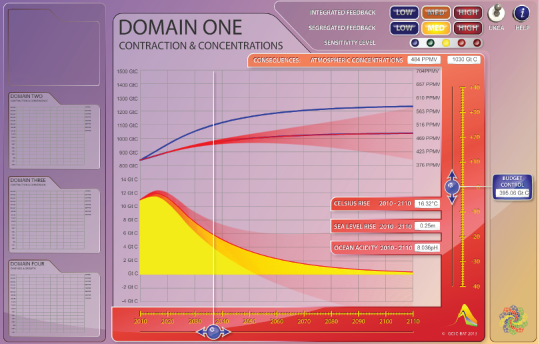
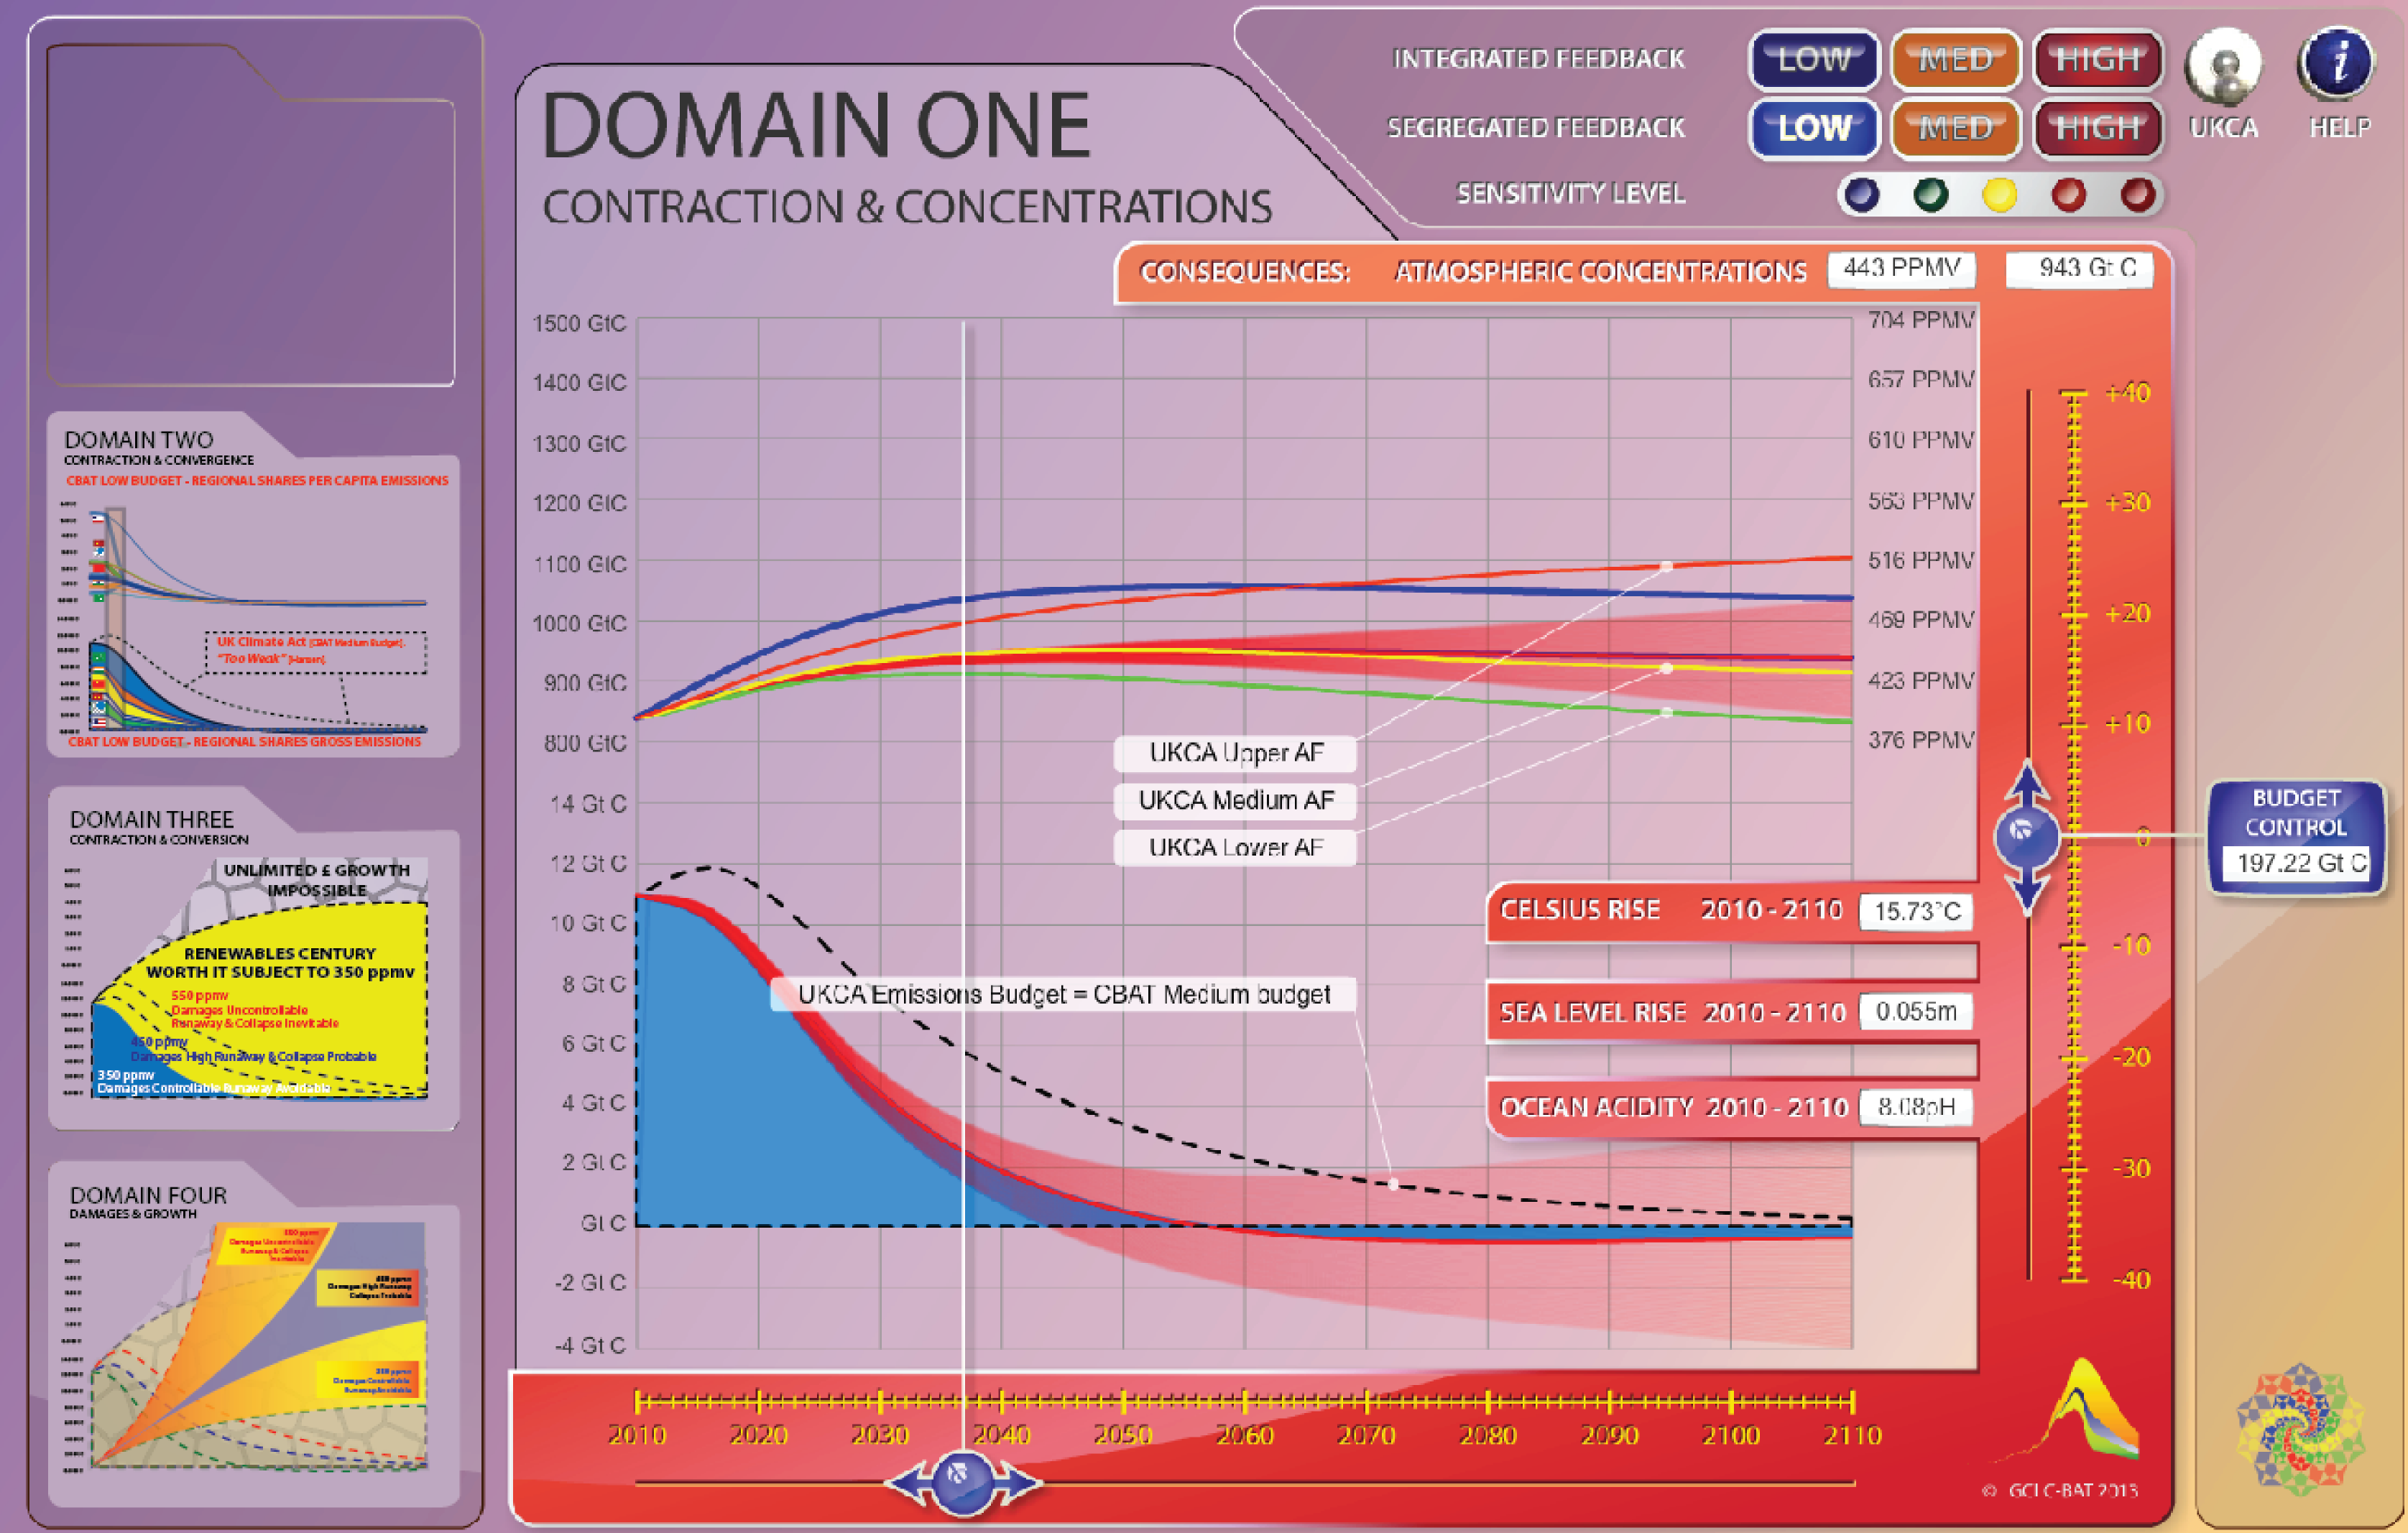
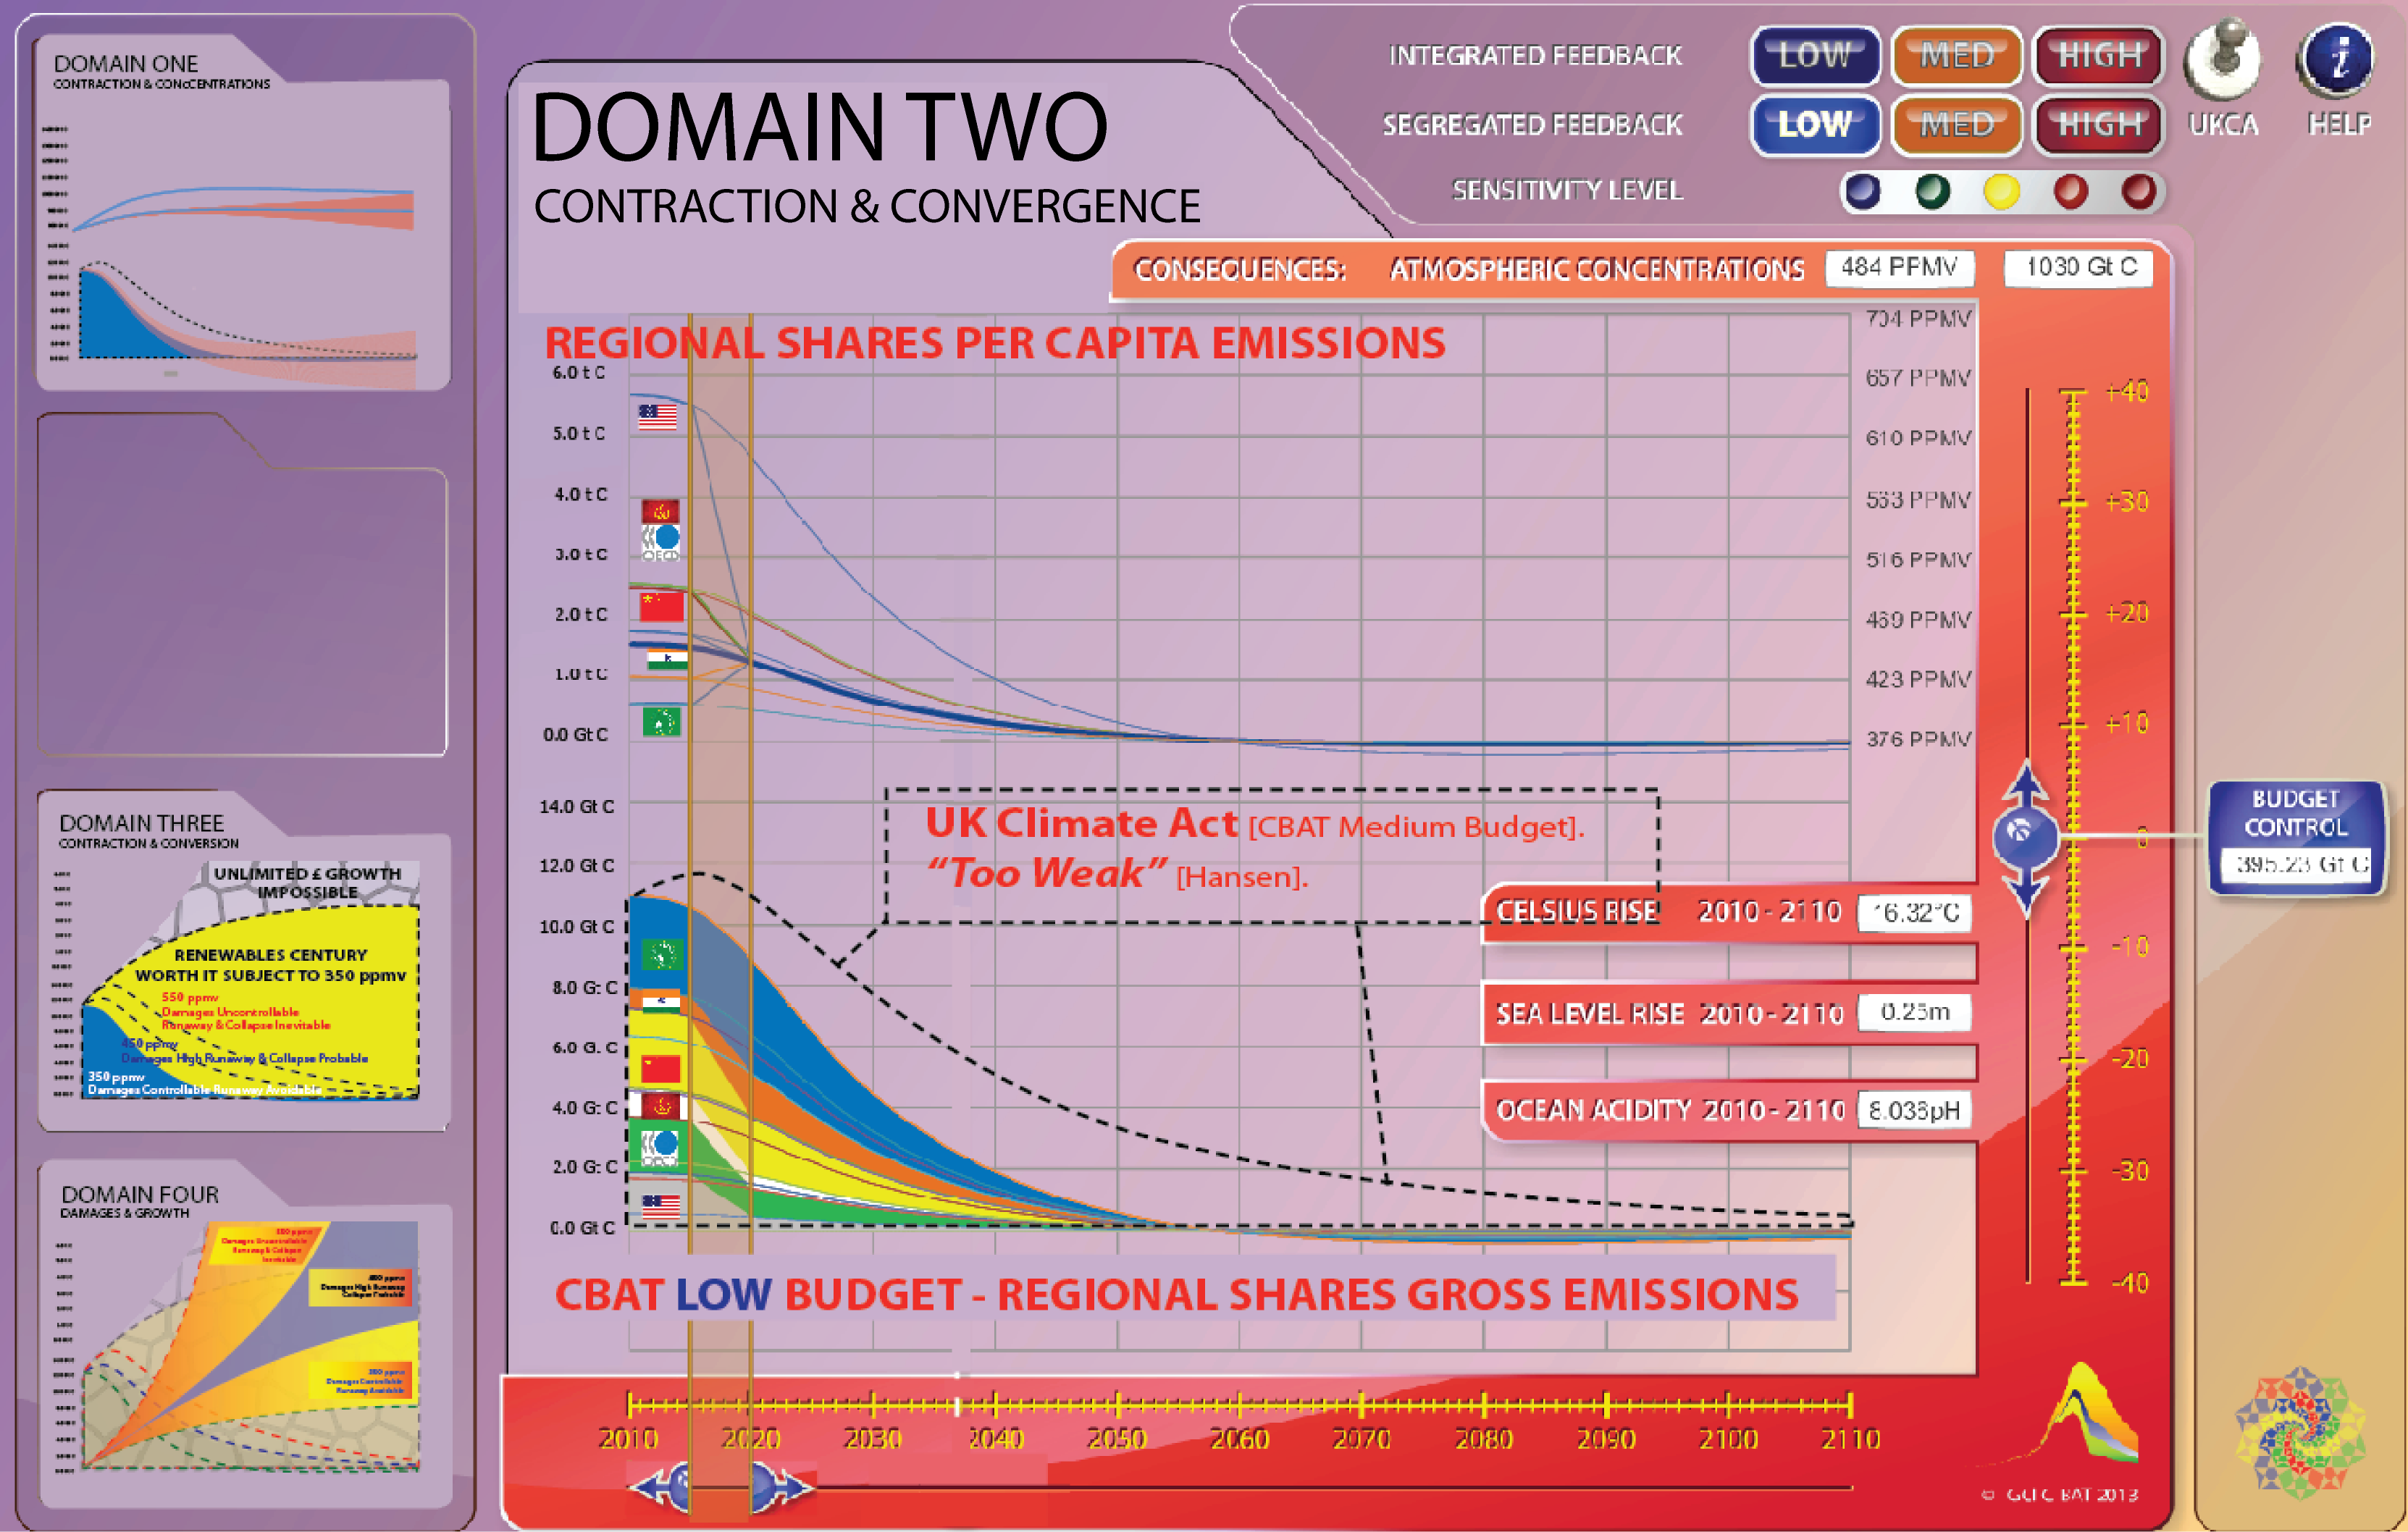
1. Above is an image showing the primary features of the Global ‘CO2-carbon-emissions-contraction-budget’ in the UK Climate Act which: -
Is called ‘2016 4% Low’
Flows from 2010 to 2110
Peaks in 2016 at 11.8 Gigatonnes Carbon [Gt C]
Declines on average thereafter at 4% per annum
Until by 2110 it has reached an output value of 0.3 Gt C per annum
Weighs a total of 395 Gt C between 2010 and 2110.
This is identical to the CBAT Medium Carbon-Emissions-Budget The image also shows the range of atmospheric CO2 concentration values calculated by UKMO as in the UK Climate Act. They are measured in: -
Parts Per Million by Volume [PPMV] and also as
Weight in Gigatonnes Carbon [Gt C].
This ranges through: -
10%-ile [the lowest] to
90%-ile [the highest] with the
‘Median’ case in between
Median is what UKMO call, ‘the most probable’
UKMO calculate that Median concentrations
Peak at 445 PPMV or 949.38 Gt C in 2050 and
Fall to 426 PPMV or 910.24 Gt C by 2100.
This means that with the Median case, 19 PPMV or 39.14 Gt C
was removed from the atmosphere [equivalent to negative feedback] 2050-2110
It also means that in total over the period 2010-2110
while the human budget emissions in 2016 4% Low totalled 395.95 Gt C
with 'Median' concentrations only a net total of 78.8 Gt C was added to the atmosphere.
This result is really questionable, even without feedback fully integrated in UKMO’s model. When feedbacks omitted are added, UKMO’s Median result is entirely implausible.
~~~~~~~~~~~~~~~~~~~~~~~~~~~~~~~~~~~~~~~~~~~
The UK Climate Act - With UKMO's Error Bars on 'Carbon-Sinks'
A high-resolution TIFF file of this image is Here
Quick view PDF version of this image Here
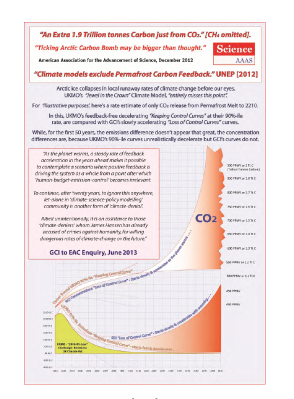
2. With their 'Median' case for atmosphere CO2 concentrations, UKMO claims that by 2050 atmosphere concentrations of CO2 are falling as ‘most probable’. This is because they claimed that CO2 sinks are removing more than 100% of human source emissions from 2050. With feedbacks omitted this is ‘most improbable’.
In the image above, the ‘Stock’ array of atmosphere concentrations of CO2 is converted to weight so it can more easily be compared with the annual ‘Flow’ of CO2 emissions in the ‘carbon-budget’. This way we can easily assess a 13-step range for the changing ‘Airborne Fraction of Emissions’ in the different concentration pathways from the: -
10%-ile, the lowest concentration returning to 390 PPMV, adding 4 steps to
Median - UKMO’s ‘most probable’ pathway to 427 PPMV, with a further 7 steps to
the 90%-ile, their highest concentration, rising to 516 PPMV.
With UKMO’s ‘Median’ case, the model states that by 2050, concentrations are falling as sinks are re-absorbing more than the sources of human emissions coming from the Climate Act’s ‘carbon-budget’ from 2050. With feedbacks omitted this is ‘most improbable’.
GCI choses to call this result, ‘greater than 100% sink-efficiency by 2050’.
The UKMO are welcome to disagree with this term and to call it whatever they choose. However, changing the name won’t change what is revealed in the numerical analysis of what they published in the UK Climate Act – i.e. that sinks are absorbing more than sources by 2050.
The carbon-budget is primarily fossil-carbon. Once dug up and burned it has to go somewhere. What doesn’t stay in the atmosphere [the fraction retained] goes into the biological sinks on land and in the ocean [fraction returned]. In reality, that is true only to the extent these sinks hold up and can absorb this huge and sudden addition of carbon.
With various feedbacks omitted from UKMO’s model, this result is unrealistic and untrustworthy as a basis for strategic and precautionary global climate policy.
Moreover, the UK Climate Act CO2 ‘Sink Function’ from 10%-ile to 90%-ile covers the extreme range of: -
0% - 70% Fractions-Retained or
100% - 30% Fractions-Returned
Depending on the position selected, the whole budget is re-absorbed [returned in position 1] through to three quarters of it remaining in the atmosphere [retained in position 13]. This is not a small range of possibilities [uncertainties] it is huge. In policy terms it’s like saying the car-speed-limit is somewhere between plus and minus 50 mile an hour.
Moreover, GCI is of the view that UKMO climate-modellers have overestimated the capacity of the terrestrial and oceanic sinks to absorb the emissions consequences of burning huge amounts of fossil carbon [oil, coal and gas] that were not in the biological carbon-cycle until they were minded, burned and sent as greenhouse-flue-gas to the atmosphere.
All the extra carbon being dumped in the ocean, as a result of UKMO’s Median ‘sink-efficiency’ would raise CO2 concentration in the oceans, instead of in the atmosphere, lowering pH. UKMO says this will not lower pH as the ‘biological pump’ will remove it as the build-up accelerates. This is unsound as the pump operates on a timescale of Decades to Centuries and not the Years to Decades necessary to achieve what UKMO claim.
At this point it is also worth noting that the CO2 from Permafrost melt is not fossil carbon. However, until the Permafrost melts it is not in the biological carbon-cycle either. As it is released due to melting, it is biological and this is augmented by the soils themselves becoming biologically active and generating more yet more CO2 from this as well.
Estimates in AAAS Science for the scale of just this CO2 are in the region of an extra 1.9 trillion tonnes of carbon [1.5 Tt C] see Here.
~~~~~~~~~~~~~~~~~~~~~~~~~~~~~~~~~~~~~~~~~~~
The UK Climate Act - With UKMO's 'Carbon-Budget' array-adjusted
A high-resolution TIFF file of this image is Here
Quick view PDF version of this image Here
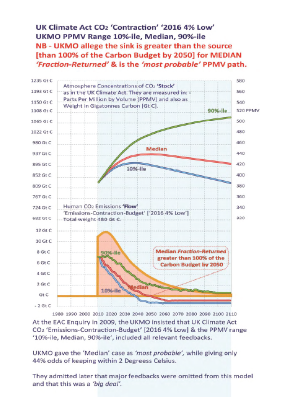
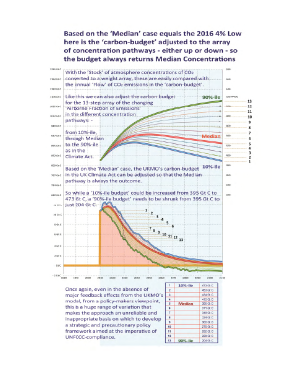
3. Based on the ‘Median’ case as in UKCA ‘2016 4% Low’, here is the ‘carbon-budget’ adjusted to the array of concentration pathways - either up or down - so the budget levels are adjusted always to return Median Concentrations whichever of the 13 levels of ‘probability’ is chosen.
So if the Median concentration pathway is not as-stated the ‘most probable’, UKMO’s huge range creates a policy maker’s nightmare. UKMO’s approach is perhaps at best ‘illustrative’ as it is certainly not precise or precautionary.
With the ‘Stock’ of atmosphere concentrations of CO2 converted to a weight array, these are easily compared with the annual ‘Flow’ of CO2 emissions in the ‘carbon-budget’.
Like this we can also adjust the carbon budget for the 13-step array of the changing ‘Airborne Fraction of Emissions’ in the different concentration pathways in UKCA: -
From 10%-ile,
Through Median
To the 90%-ile
Since the commitment at COP-15 was not to exceed 2 degrees, which of UKMO’s Contraction:Concentrations pathway should we trust?
Based on UKMO’s ‘Median’ being the ‘most probable’ being in their words, values that give us just a ‘44% chance’ of keeping to 2 degrees, we can set these values as the reference-concentrations-case, and adjust UKMO’s Carbon-Budget for all 13 positions so that these ‘Median’ PPMV values are always the outcome. The range of values is huge.
As the chart shows, while a: -
'10%-ile adjusted budget’ could be increased from 395 Gt C to 473 Gt C, a
‘90%-ile adjusted budget’ needs to be decreased from 395 Gt C to just 204 Gt C
Here is the full set of budget-integrals for adjustments against the array given.
1
'10%-ile'
473 Gt C
2
Median-3
453 Gt C
3
Median-2
434 Gt C
4
Median-1
415 Gt C
5
'MEDIAN'+0
395 Gt C
6
Median+1
371 Gt C
7
Median+2
348 Gt C
8
Median+3
324 Gt C
9
Median+4
300 Gt C
10
Median+5
276 Gt C
11
Median+6
252 Gt C
12
Median+7
228 Gt C
13
'90%-ile'
204 Gt C
In reality, we need to fix the safe and stable concentration level and be transparent about the precautionary - and the likely - need to accelerate emissions-contraction to achieve it. As is the UK Climate Act does the reverse.
What the Act does is to fix the budget and then present a huge array of possible concentration outcomes. Moreover, this it should be remembered is even before a full ensemble of feedbacks has been included in the climate models.
So, even in the absence of these major feedback effects in the UKMO’s model, from a policy-makers viewpoint, UKMO’s huge range of variation on PPMV outcomes renders their approach an implausible basis on which to develop and then internationally negotiate the sharing of a precautionary carbon-budget with a policy framework aimed at the imperative of UNFCCC-compliance.
Once again, UKMO’s incomplete approach is ‘illustrative’ as it is certainly not ‘precautionary. Perhaps seeing it more as ‘aspirational’ than ‘rational’ is the best that can be said for it.
~~~~~~~~~~~~~~~~~~~~~~~~~~~~~~~~~~~~~~~~~~~
The UK Climate Act - With UKMO's 'Carbon-Budget' array-adjusted
A high-resolution TIFF file of this image is Here
Quick view PDF version of this image Here
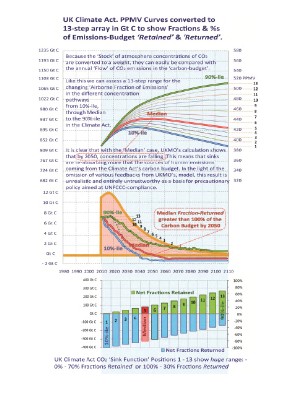
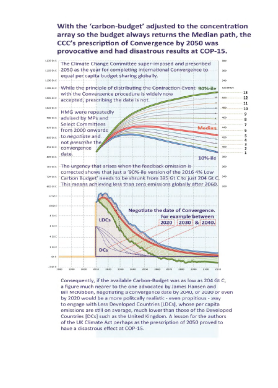
4. Using the UKMO’s ‘2016 4% Low scenario’ the Climate Change Committee [CCC] prescribed ‘2050’ as the year for completing international Convergence to equal per capita budget sharing globally.
However, “it wasn’t just inadequate, it was unfair.” While the principle of distributing the Contraction-Event with the Convergence procedure to equal per capita sharing globally is widely now accepted, prescribing the date – let-alone that date [2050] - of Convergence is not.
HMG were repeatedly advised by MPs, Select Committees, GCI and others from 2000 onwards to negotiate and not to prescribe the convergence date. The urgency that arises when the feedback omissions are addressed, shows [as addressed in the previous chart] that a ‘90%-ile version of the 2016 4% Low Carbon Budget’ needs to be shrunk from 395 Gt C to half that size at 204 Gt C*, i.e. achieving less than zero emissions globally after 2060.
In the light of this, offering to negotiate a convergence date by 2040, or 2030 or even by 2020 would have been a more politically realistic way, and a more propitious way, to engage at COP-15 with Less Developed Countries [LDCs], whose per capita emissions are still on average, much lower than those of the Developed Countries [DCs] like the UK and the US. The Chinese Government proposed this prior to COP-15 and there is diverse and considerable support for this approach. However, the UK Government completely repudiated the Chinese and then blamed them for the political fiasco that they themselves helped to create at COP-15 with this prescription.
Here however, with the ‘carbon-budget’ adjusted to the UKMO's concentrations-array, so the budget always returns the Median path regardless of their feedback risk, the CCC’s prescription of Convergence by 2050 was doubly provocative – it was inadequate and it was unfair.
As Adair Turner agreed to Colin Challen in the DECC Committee enquiry in 2009, “if the rate of contraction must be accelerated for reasons of urgency, the rate of convergence must be accelerated for reasons of equity.”
~~~~~~~~~~~~~~~~~~~~~~~~~~~~~~~~~~~~~~~~~~~
The UK Climate Act - With UKMO's 'Carbon-Budget' array-adjusted
A high-resolution TIFF file of this image is Here
Quick view PDF version of this image Here
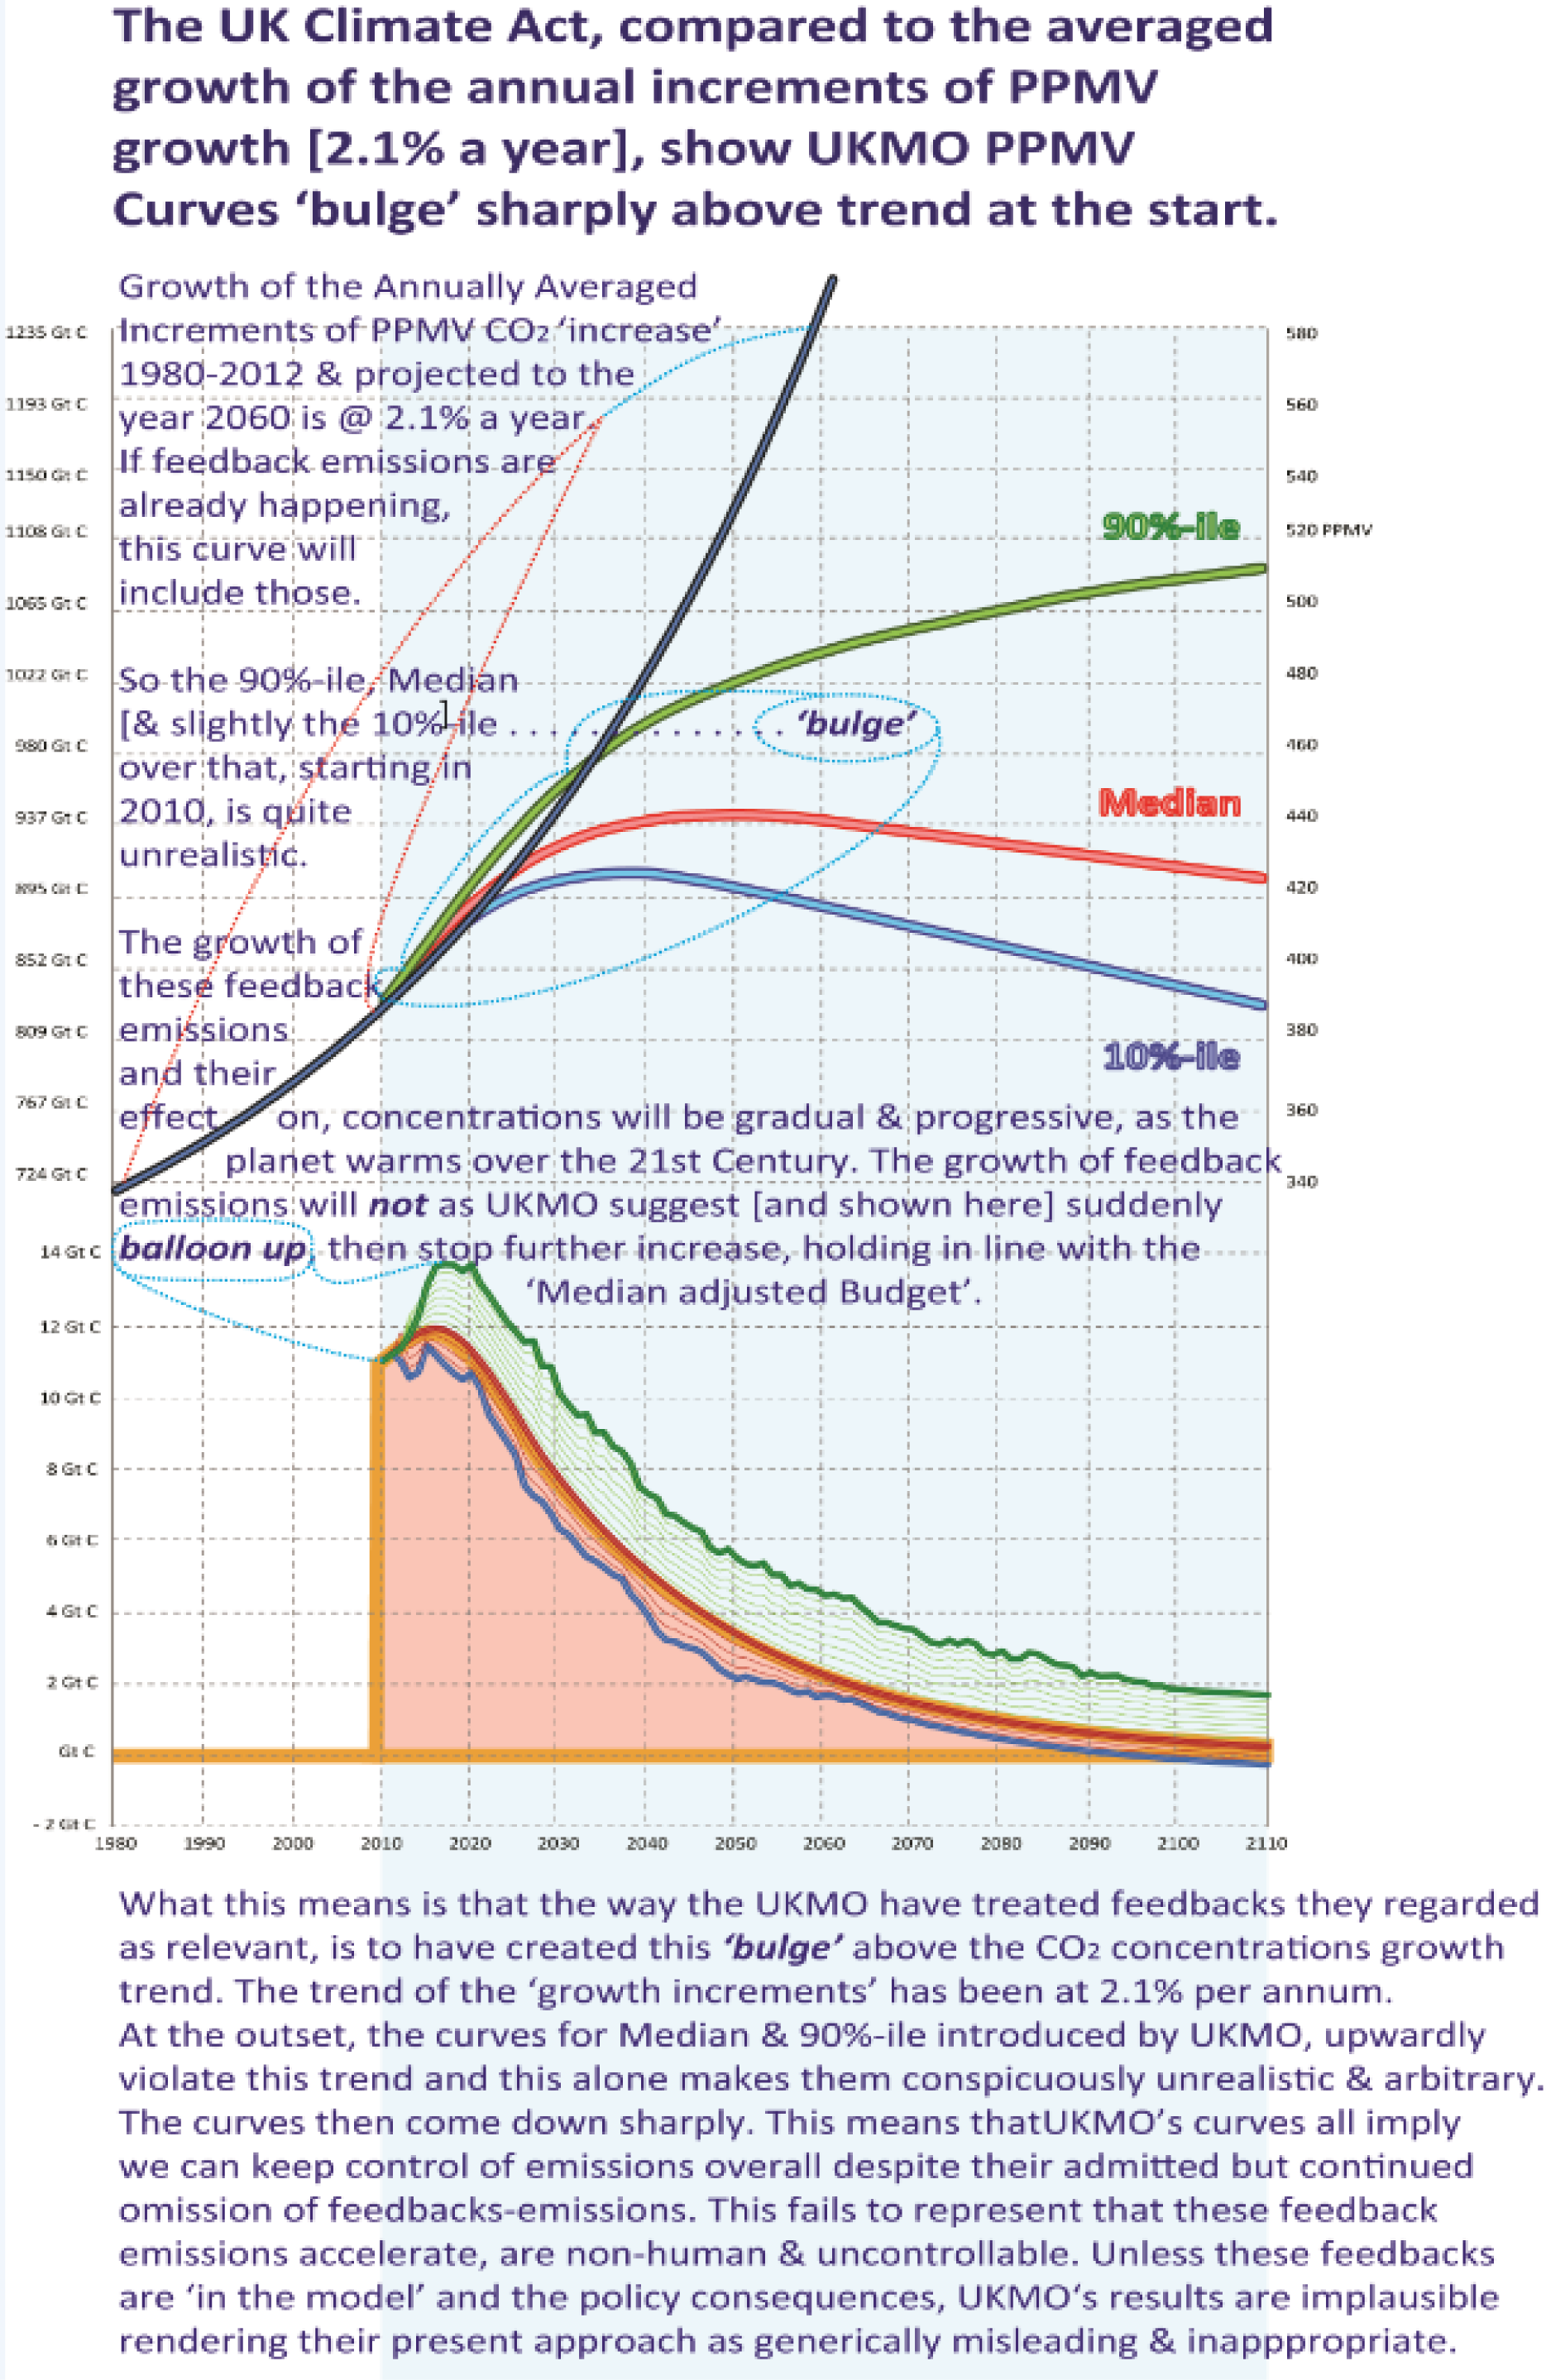
5. ‘Bulge and Trend’ – UKMO’s opaque and arbitrary array of ‘feedback-emissions’.
Growth of the Annually Averaged Increments of PPMV CO2 ‘increase’ 1980-2012 & projected here to the year 2060 is @ 2.1% a year. Whatever feedback-emissions are already happening, this trend curve will include these.
So, what is certain is that this curve will not suddenly ‘bulge upwards' as UKMO curves in the UKCA show. As in the past, the growth of these feedback-emissions and their effect on concentrations in the future will be gradual & progressive, as the planet warms over the 21st Century.
Consequently, the 90%-ile, Median [& slightly the 10%-ile] ‘bulge’ over that trend-curve, starting in 2010, is unrealistic. The trend average of the ‘growth increments’ of concentrations has been at 2.1% per annum over the last thirty years. At the outset in 2010, UKMO’s curves for Median & 90%-ile suddenly and upwardly violate this trend. This is yet another reason why UKMO’s concentration curves are arbitrary and unrealistic.
The growth of feedback emissions will not, as shown here in the UKMO UKCA climate-model, suddenly ‘bulge up’ and then stop and reverse further increase, holding in line with the ‘Median adjusted Budget’.
The way the UKMO have treated [only] the feedbacks they regarded as relevant, is to have created this quite arbitrary ‘bulge’ above the CO2 concentrations growth trend, in order [so it would appear] to then portray that the curves slow & come down even quite sharply, in other words the UKMO's 'control curves' and this is why we have called the UKMO’s curves, ‘control-curves’. They wrongly imply that if the UKCA is adhered to, we will keep control of concentrations overall.
However, feedback-effects and particularly feedback-emissions, imply that what we face is not-so-much ‘control-curves’, as ‘loss-of-control-curves’.
The point being that feedback emissions and their knock-on effect on concentrations – as in the case of CO2 emissions from Permafrost melt for example - are non-human, accelerate, start gradually but once under way the rate of increase is uncontrollable.
UKMO omits these feedback effects from their climate model. Until these feedbacks are ‘in the model’ and leading to precautionary policy consequences, UKMO‘s results are implausible and irresponsible, rendering the approach in the UK Climate Act as generically misleading & an inappropriate basis upon which to conduct precautionary climate policy for UNFCCC-compliance.