Info point 12: - CLOCKS CONCENTRATIONS 2110

2
BACK TO CBAT Graphic User Interface [GUI]


1
BACK TO ALL INFO POINTS DOMAIN 1

The consequences for concentration rise as both Parts Per Million by Volume [PPMV] and Billions of Tonnes of Carbon [Gt C] are shown in CBAT as the budget-control slider is moved up and down and can be read-off here: -

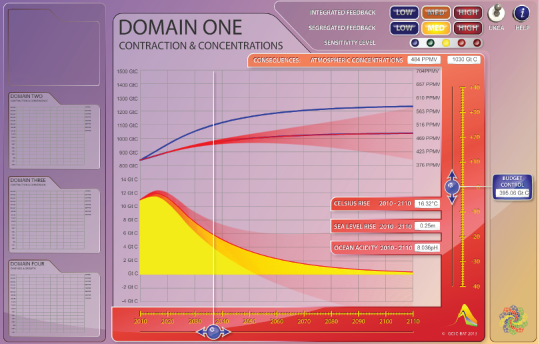
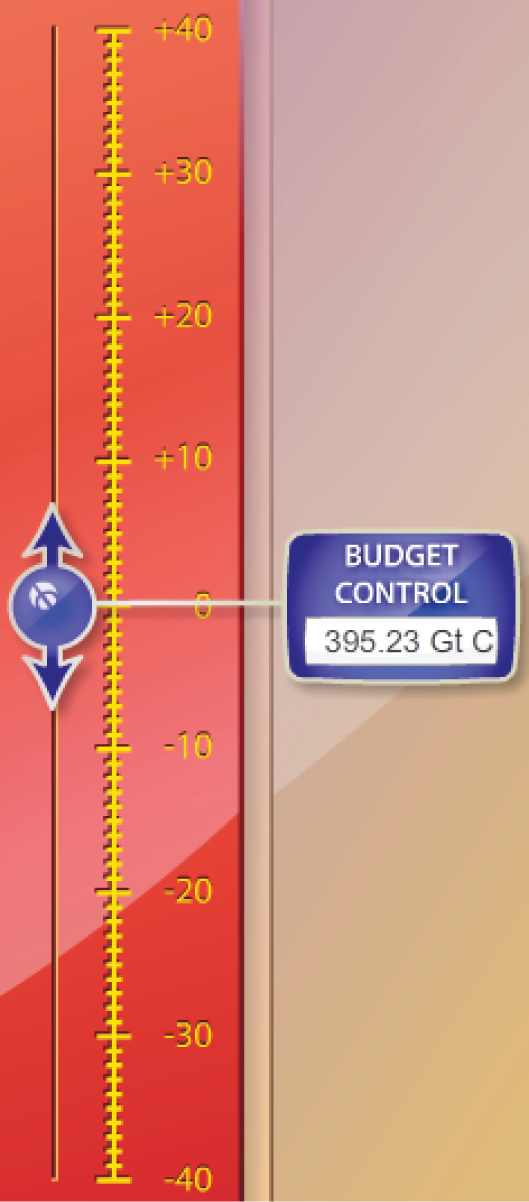
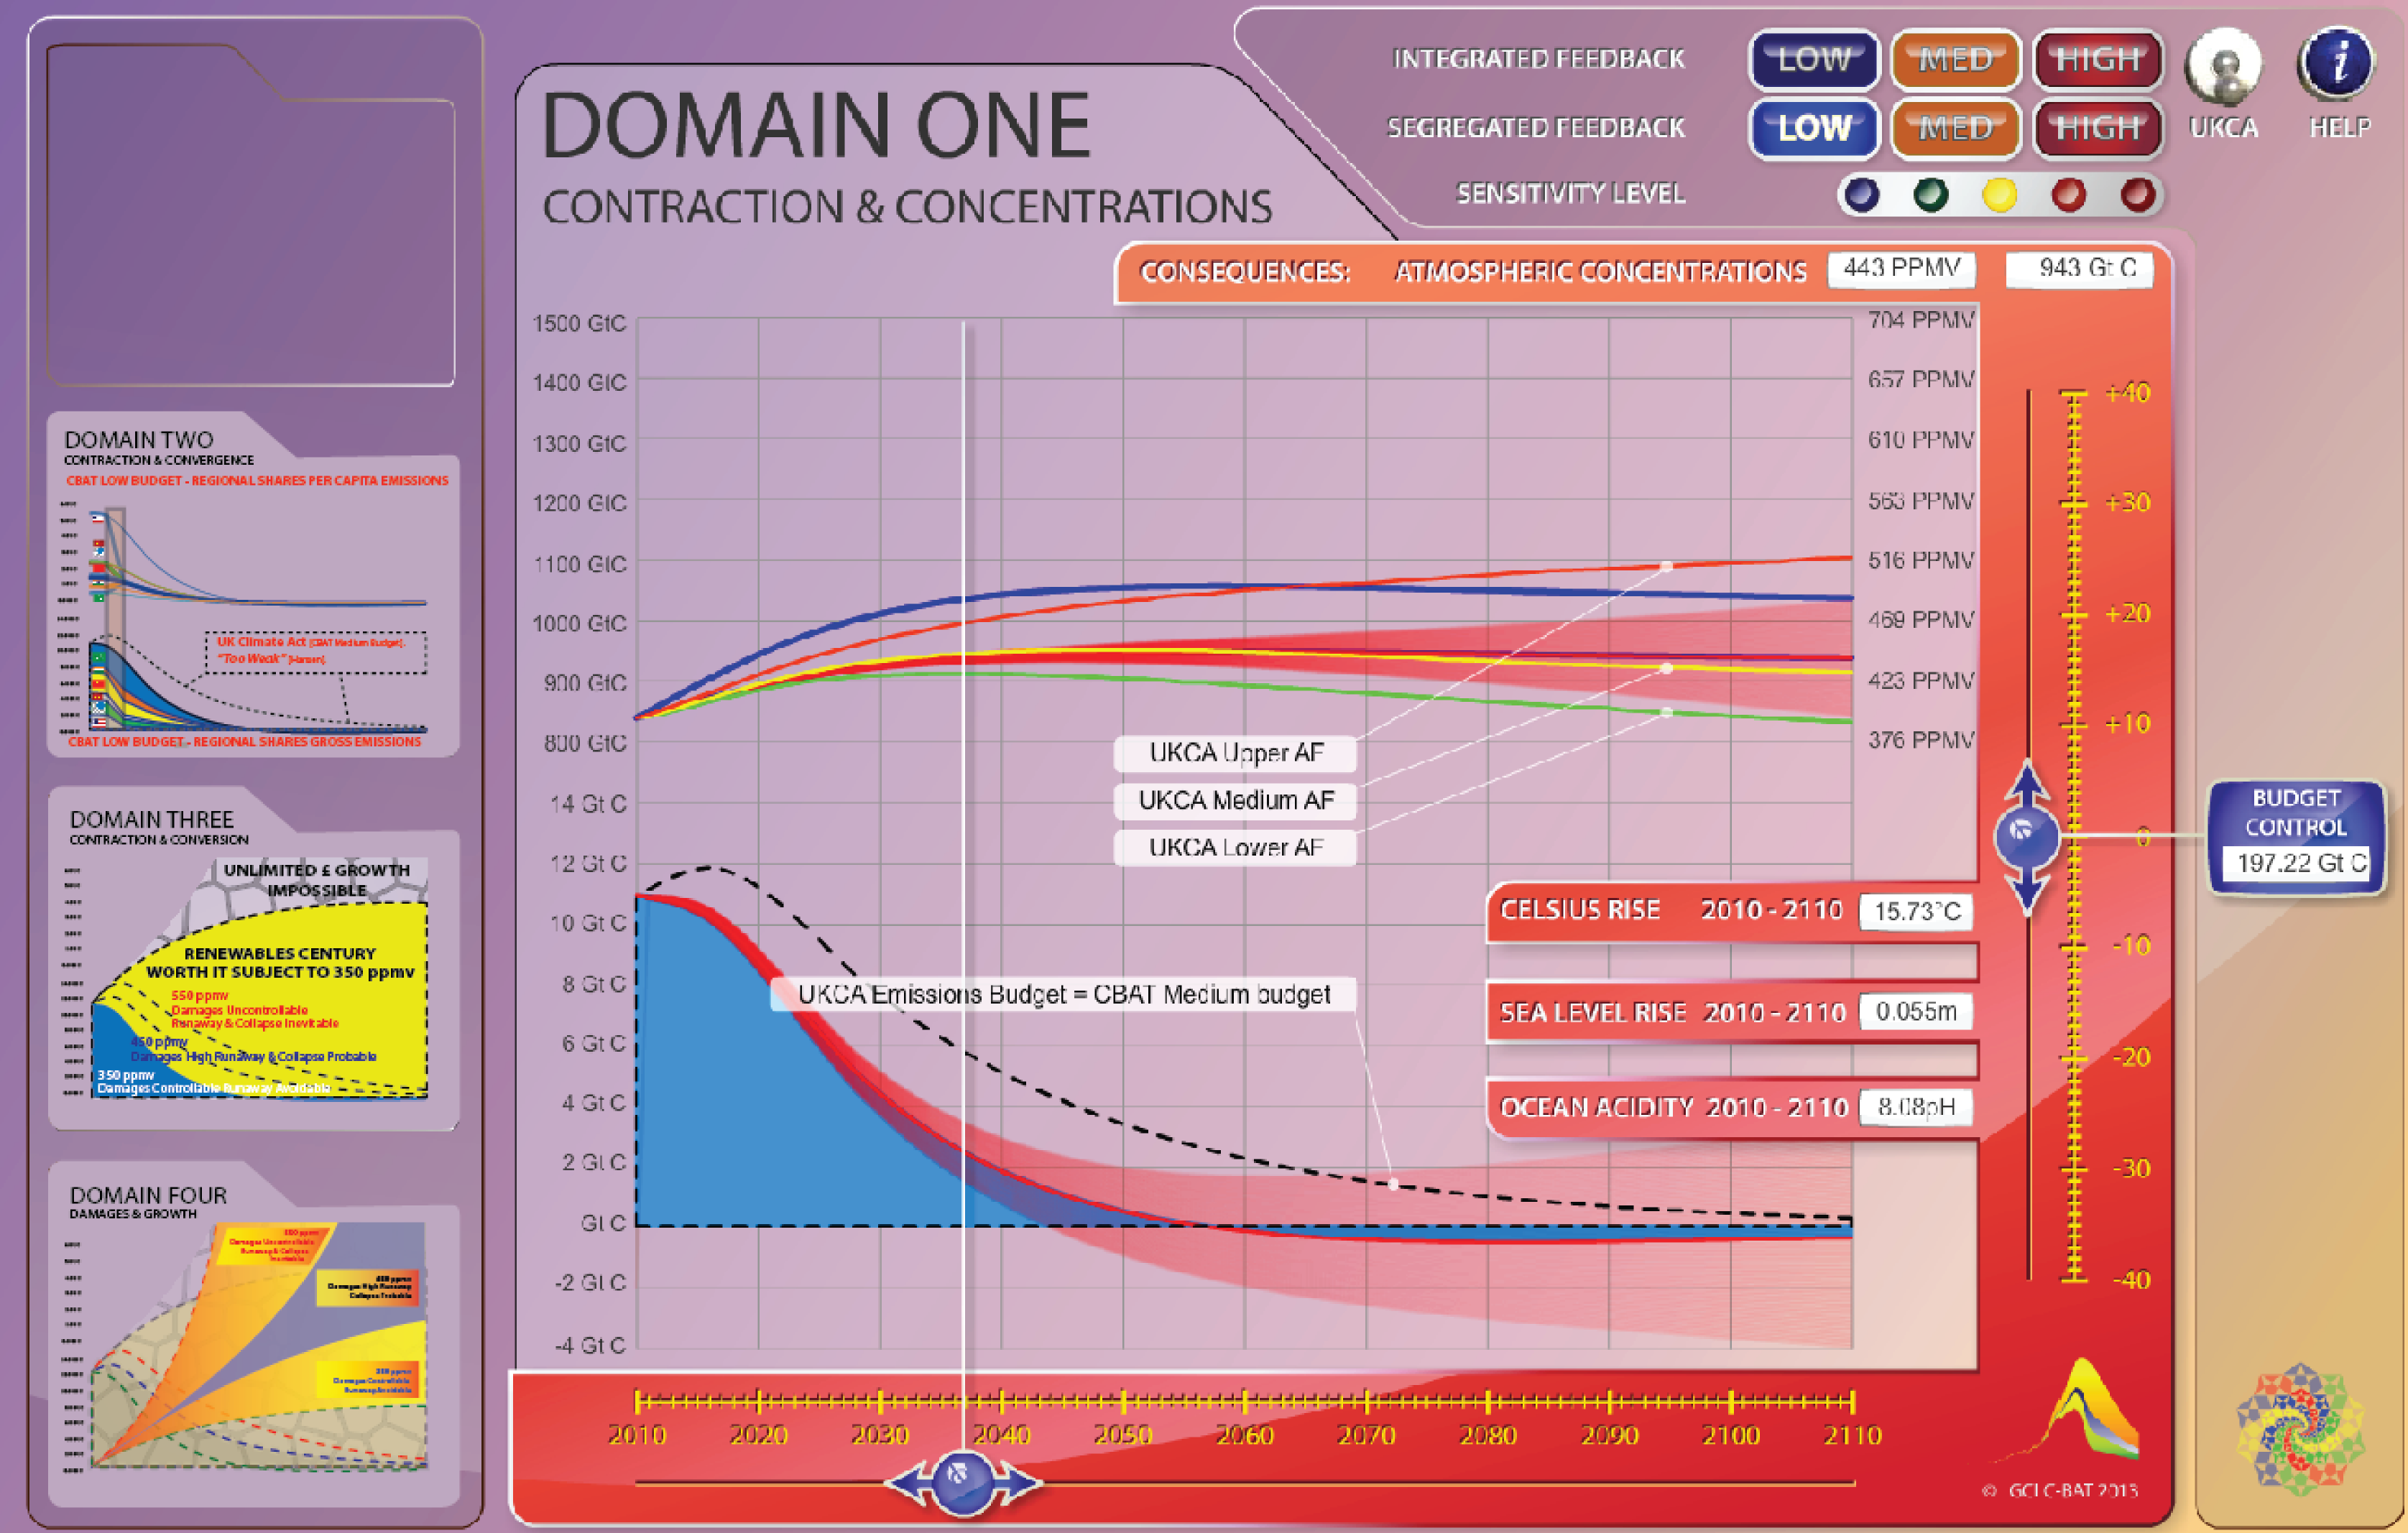
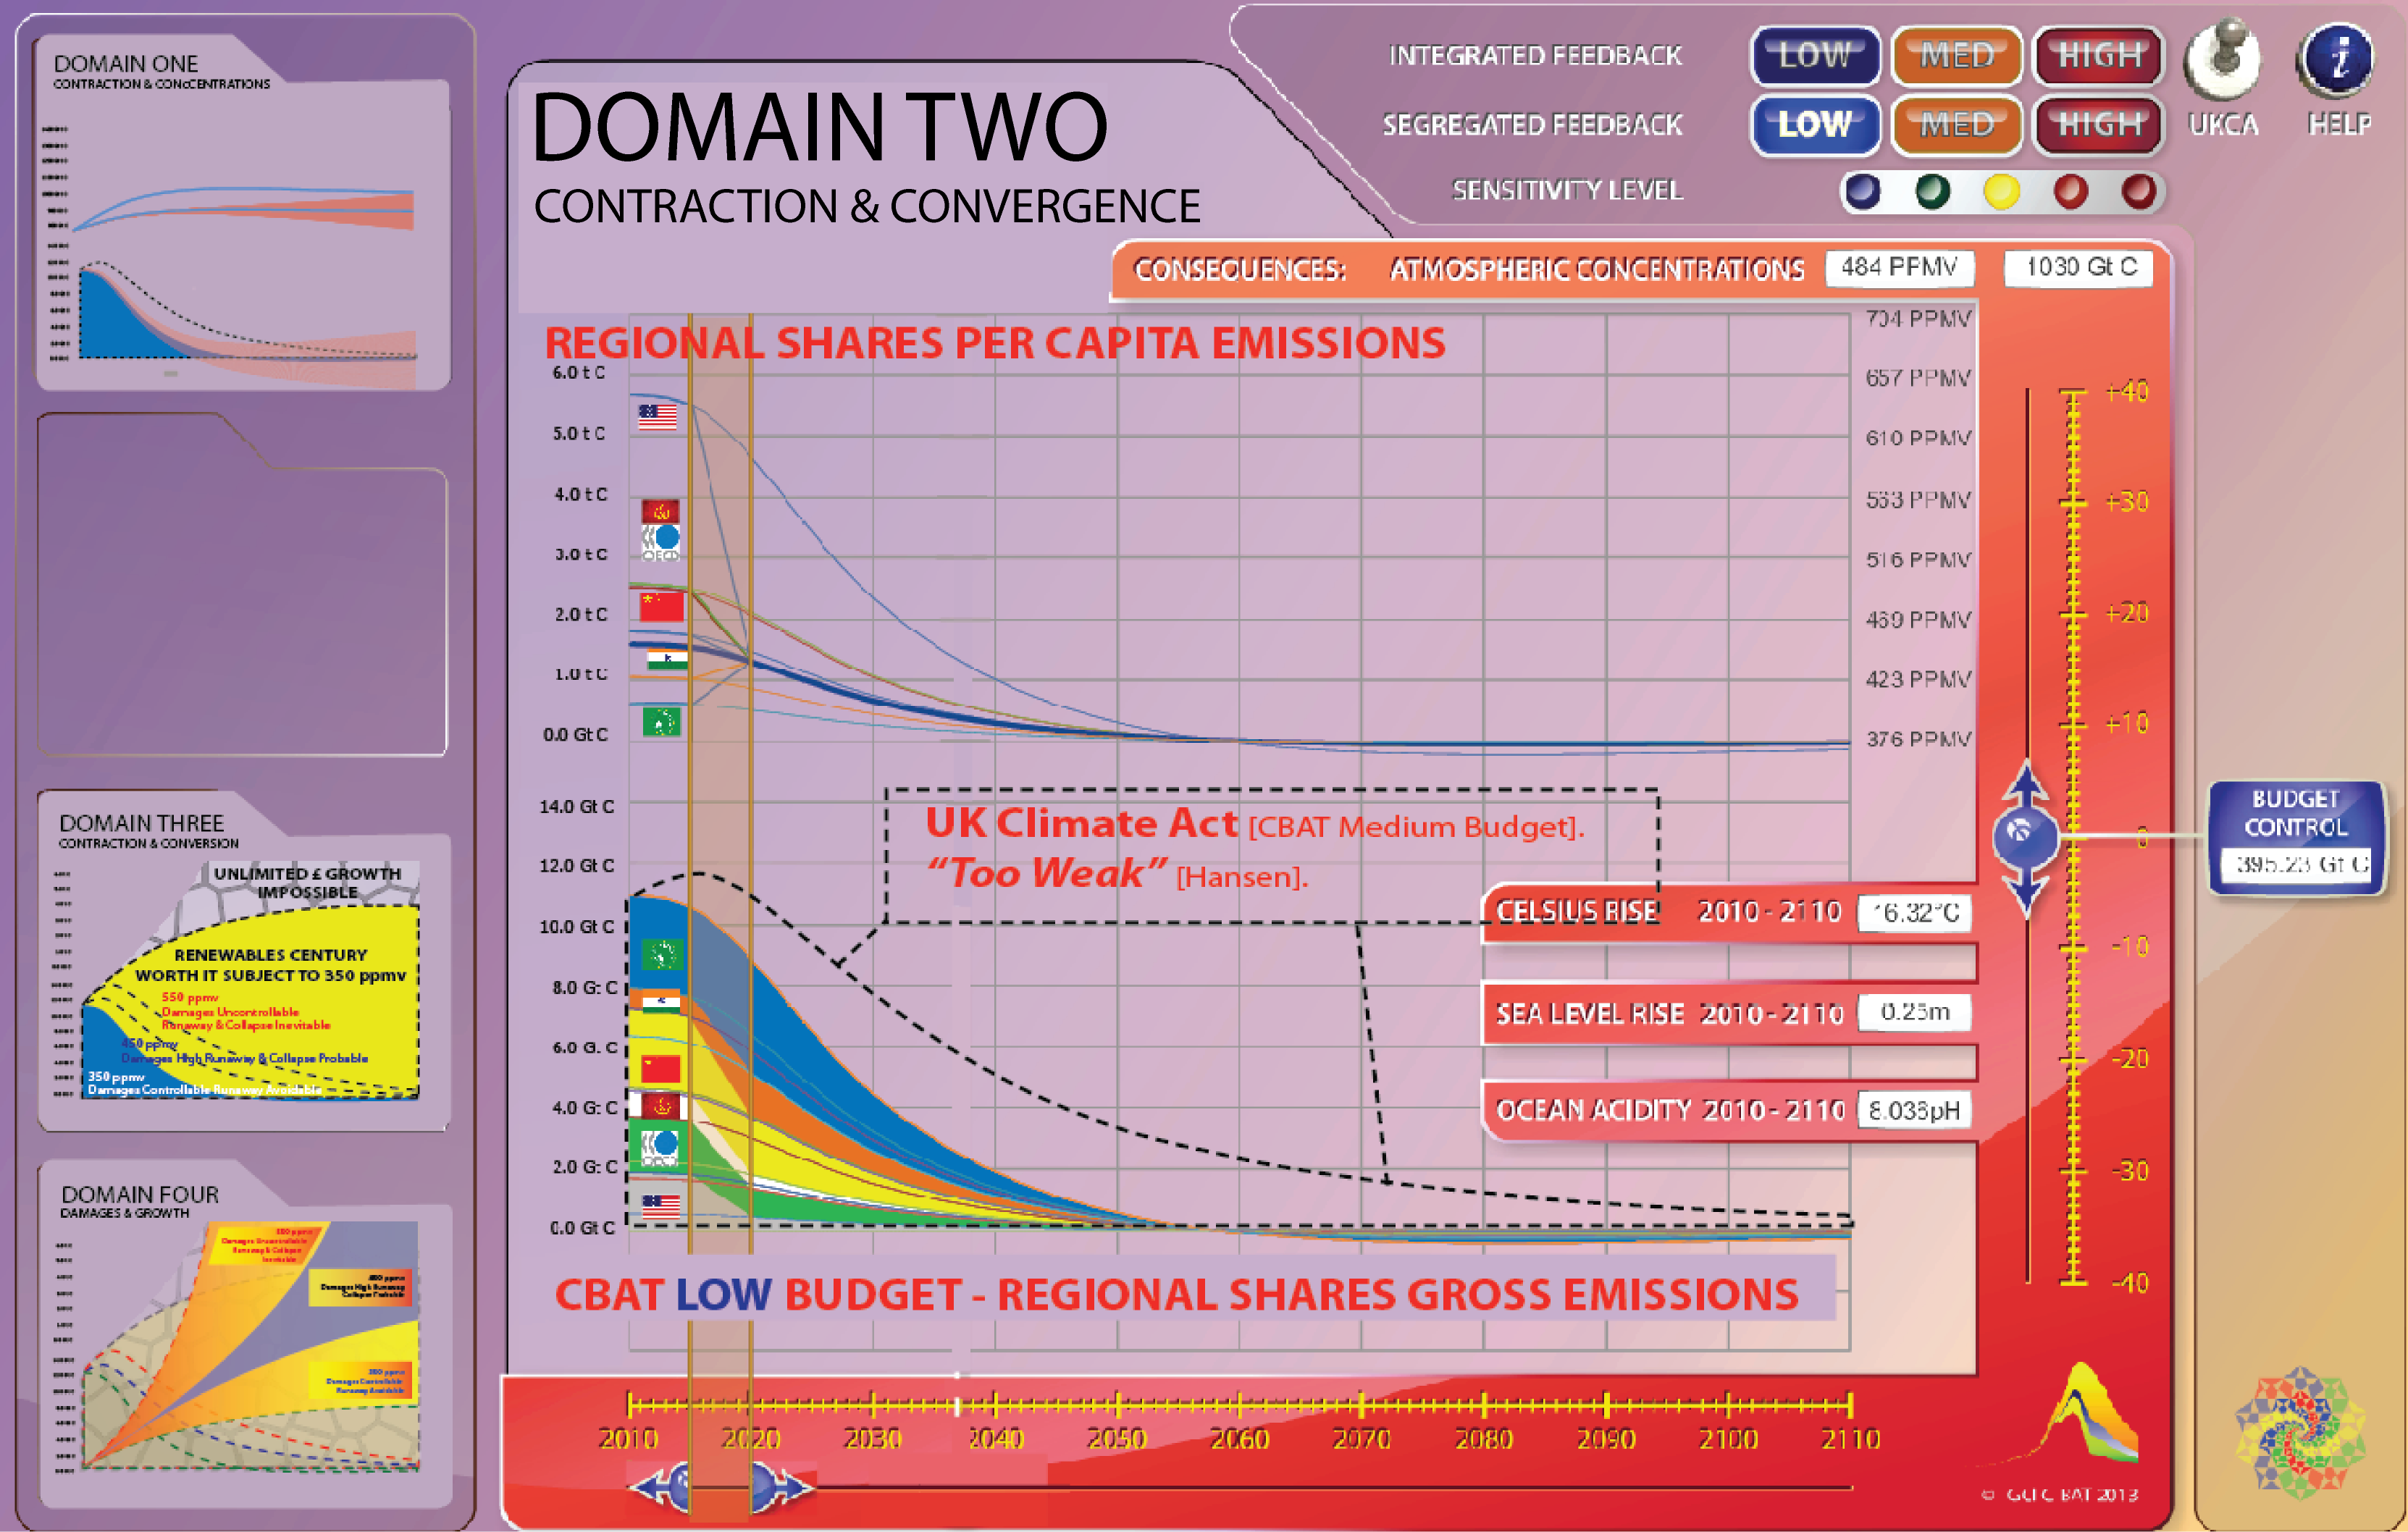
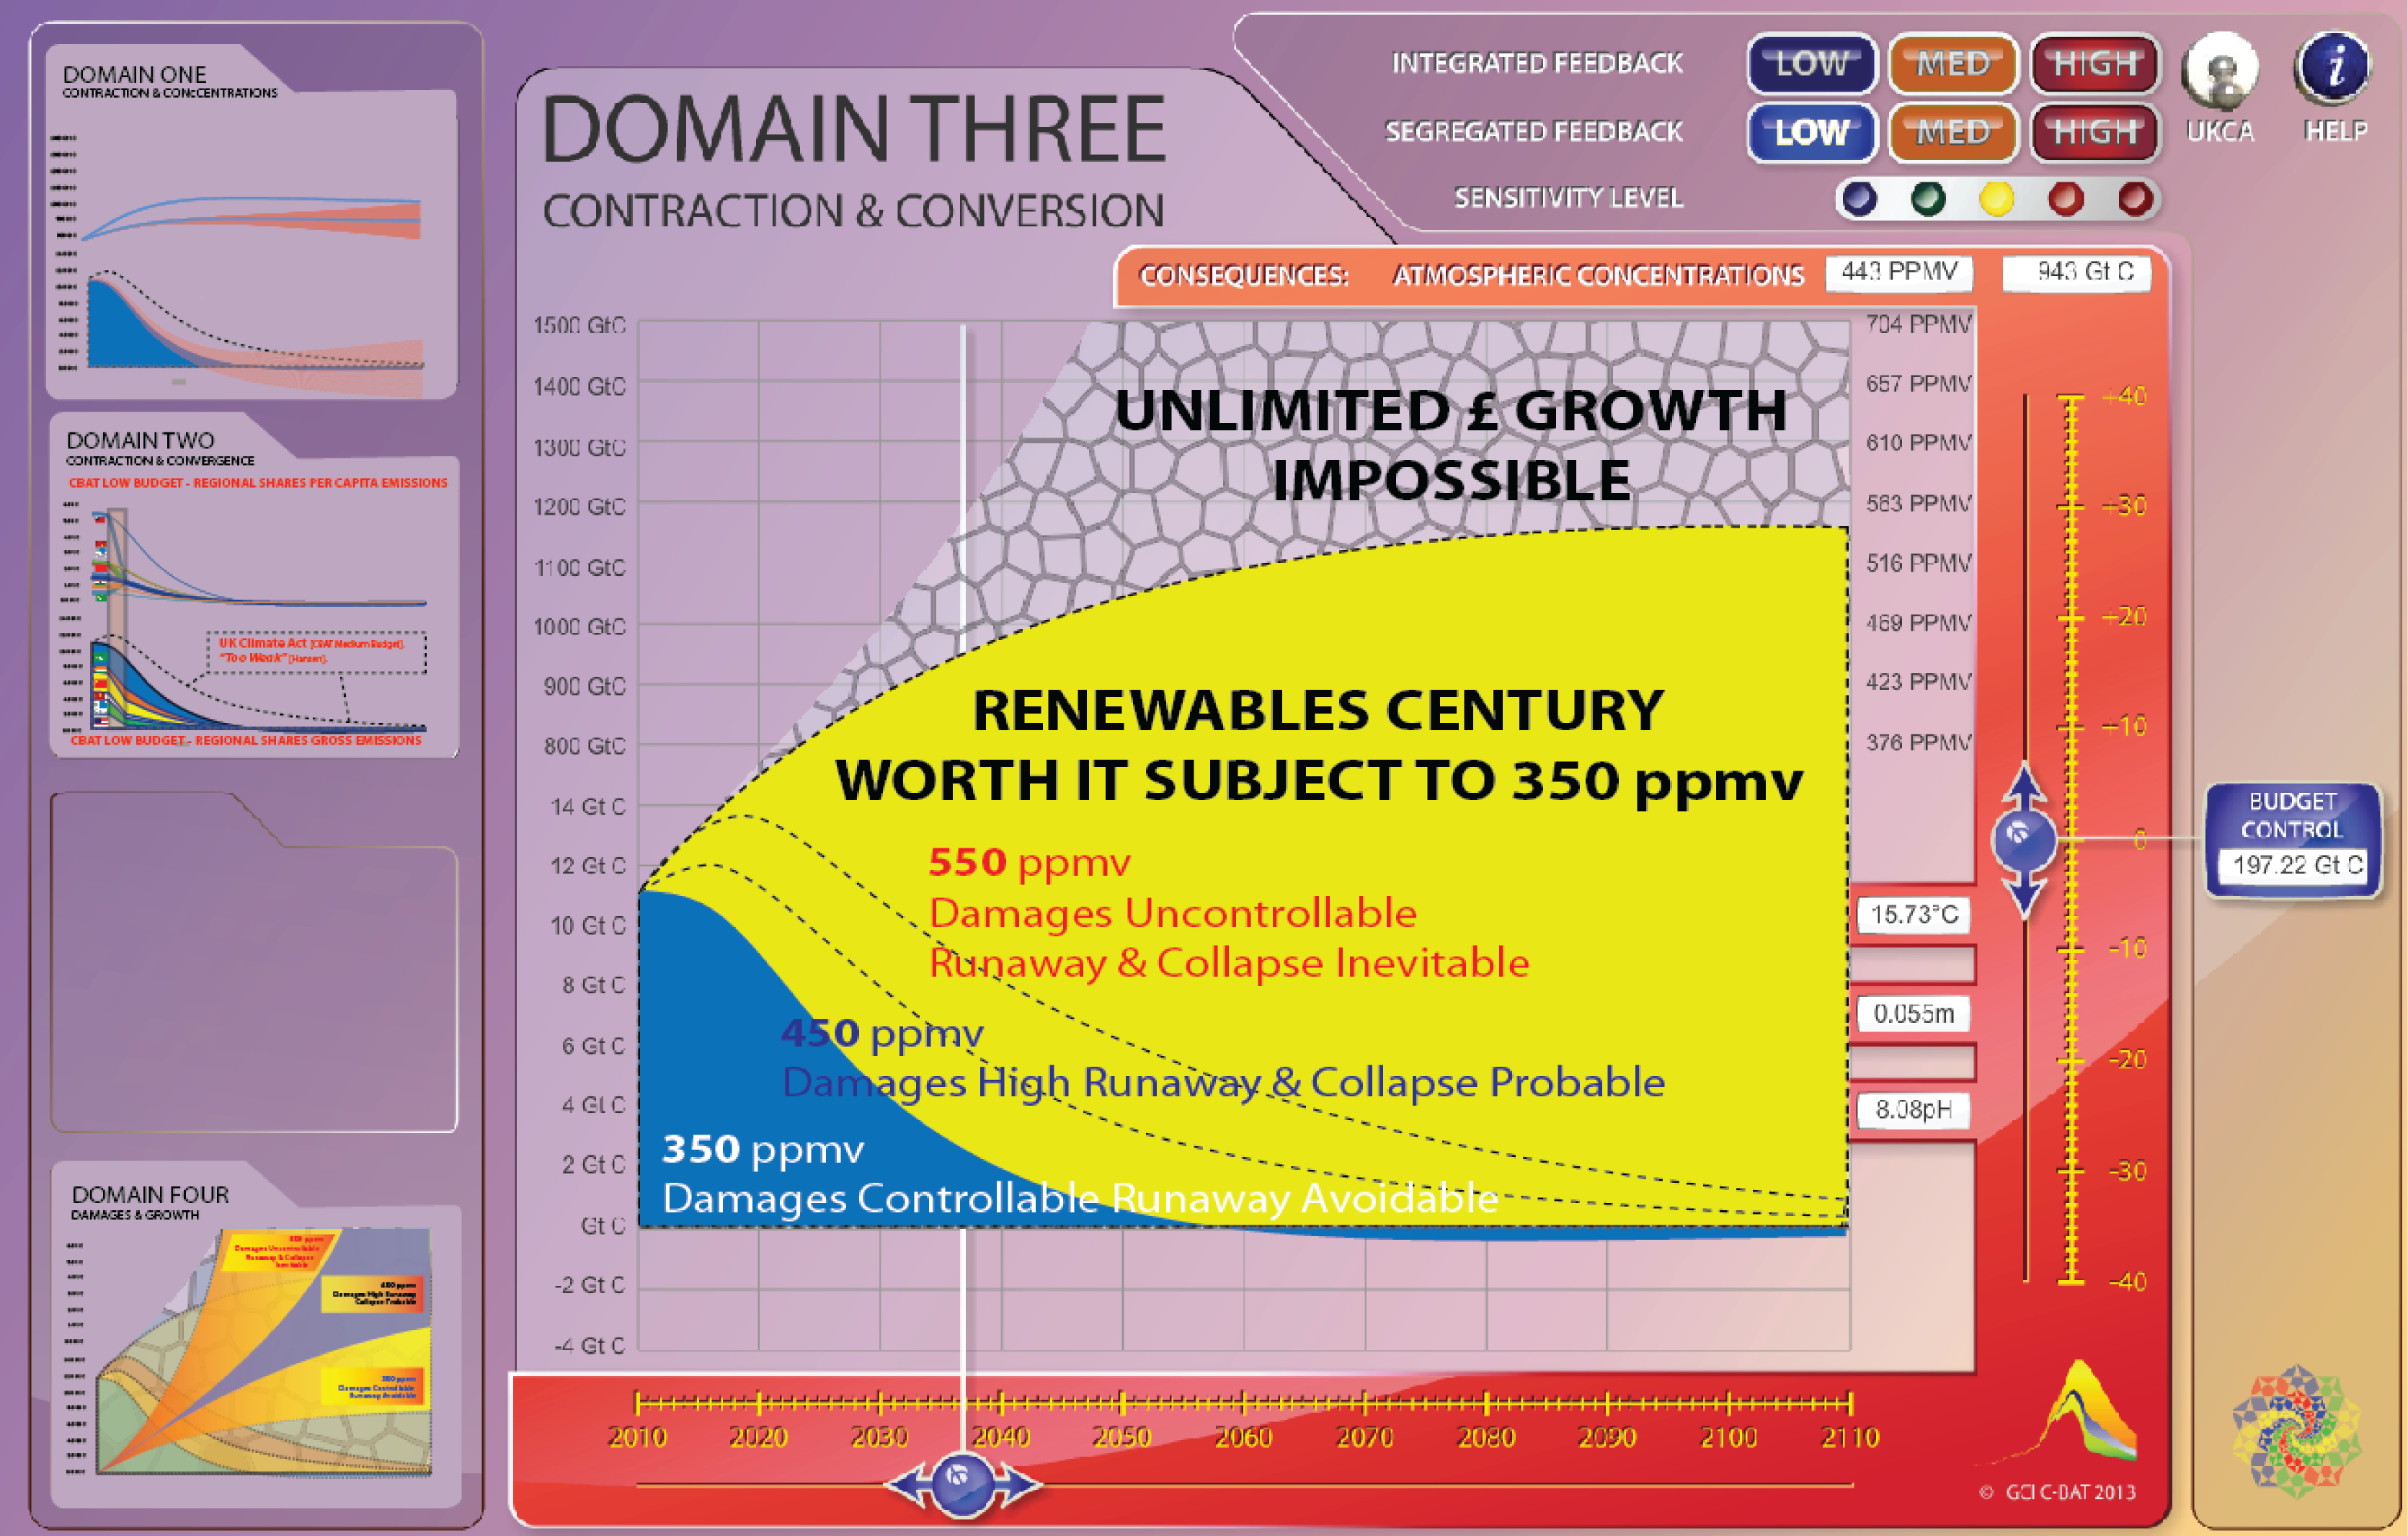
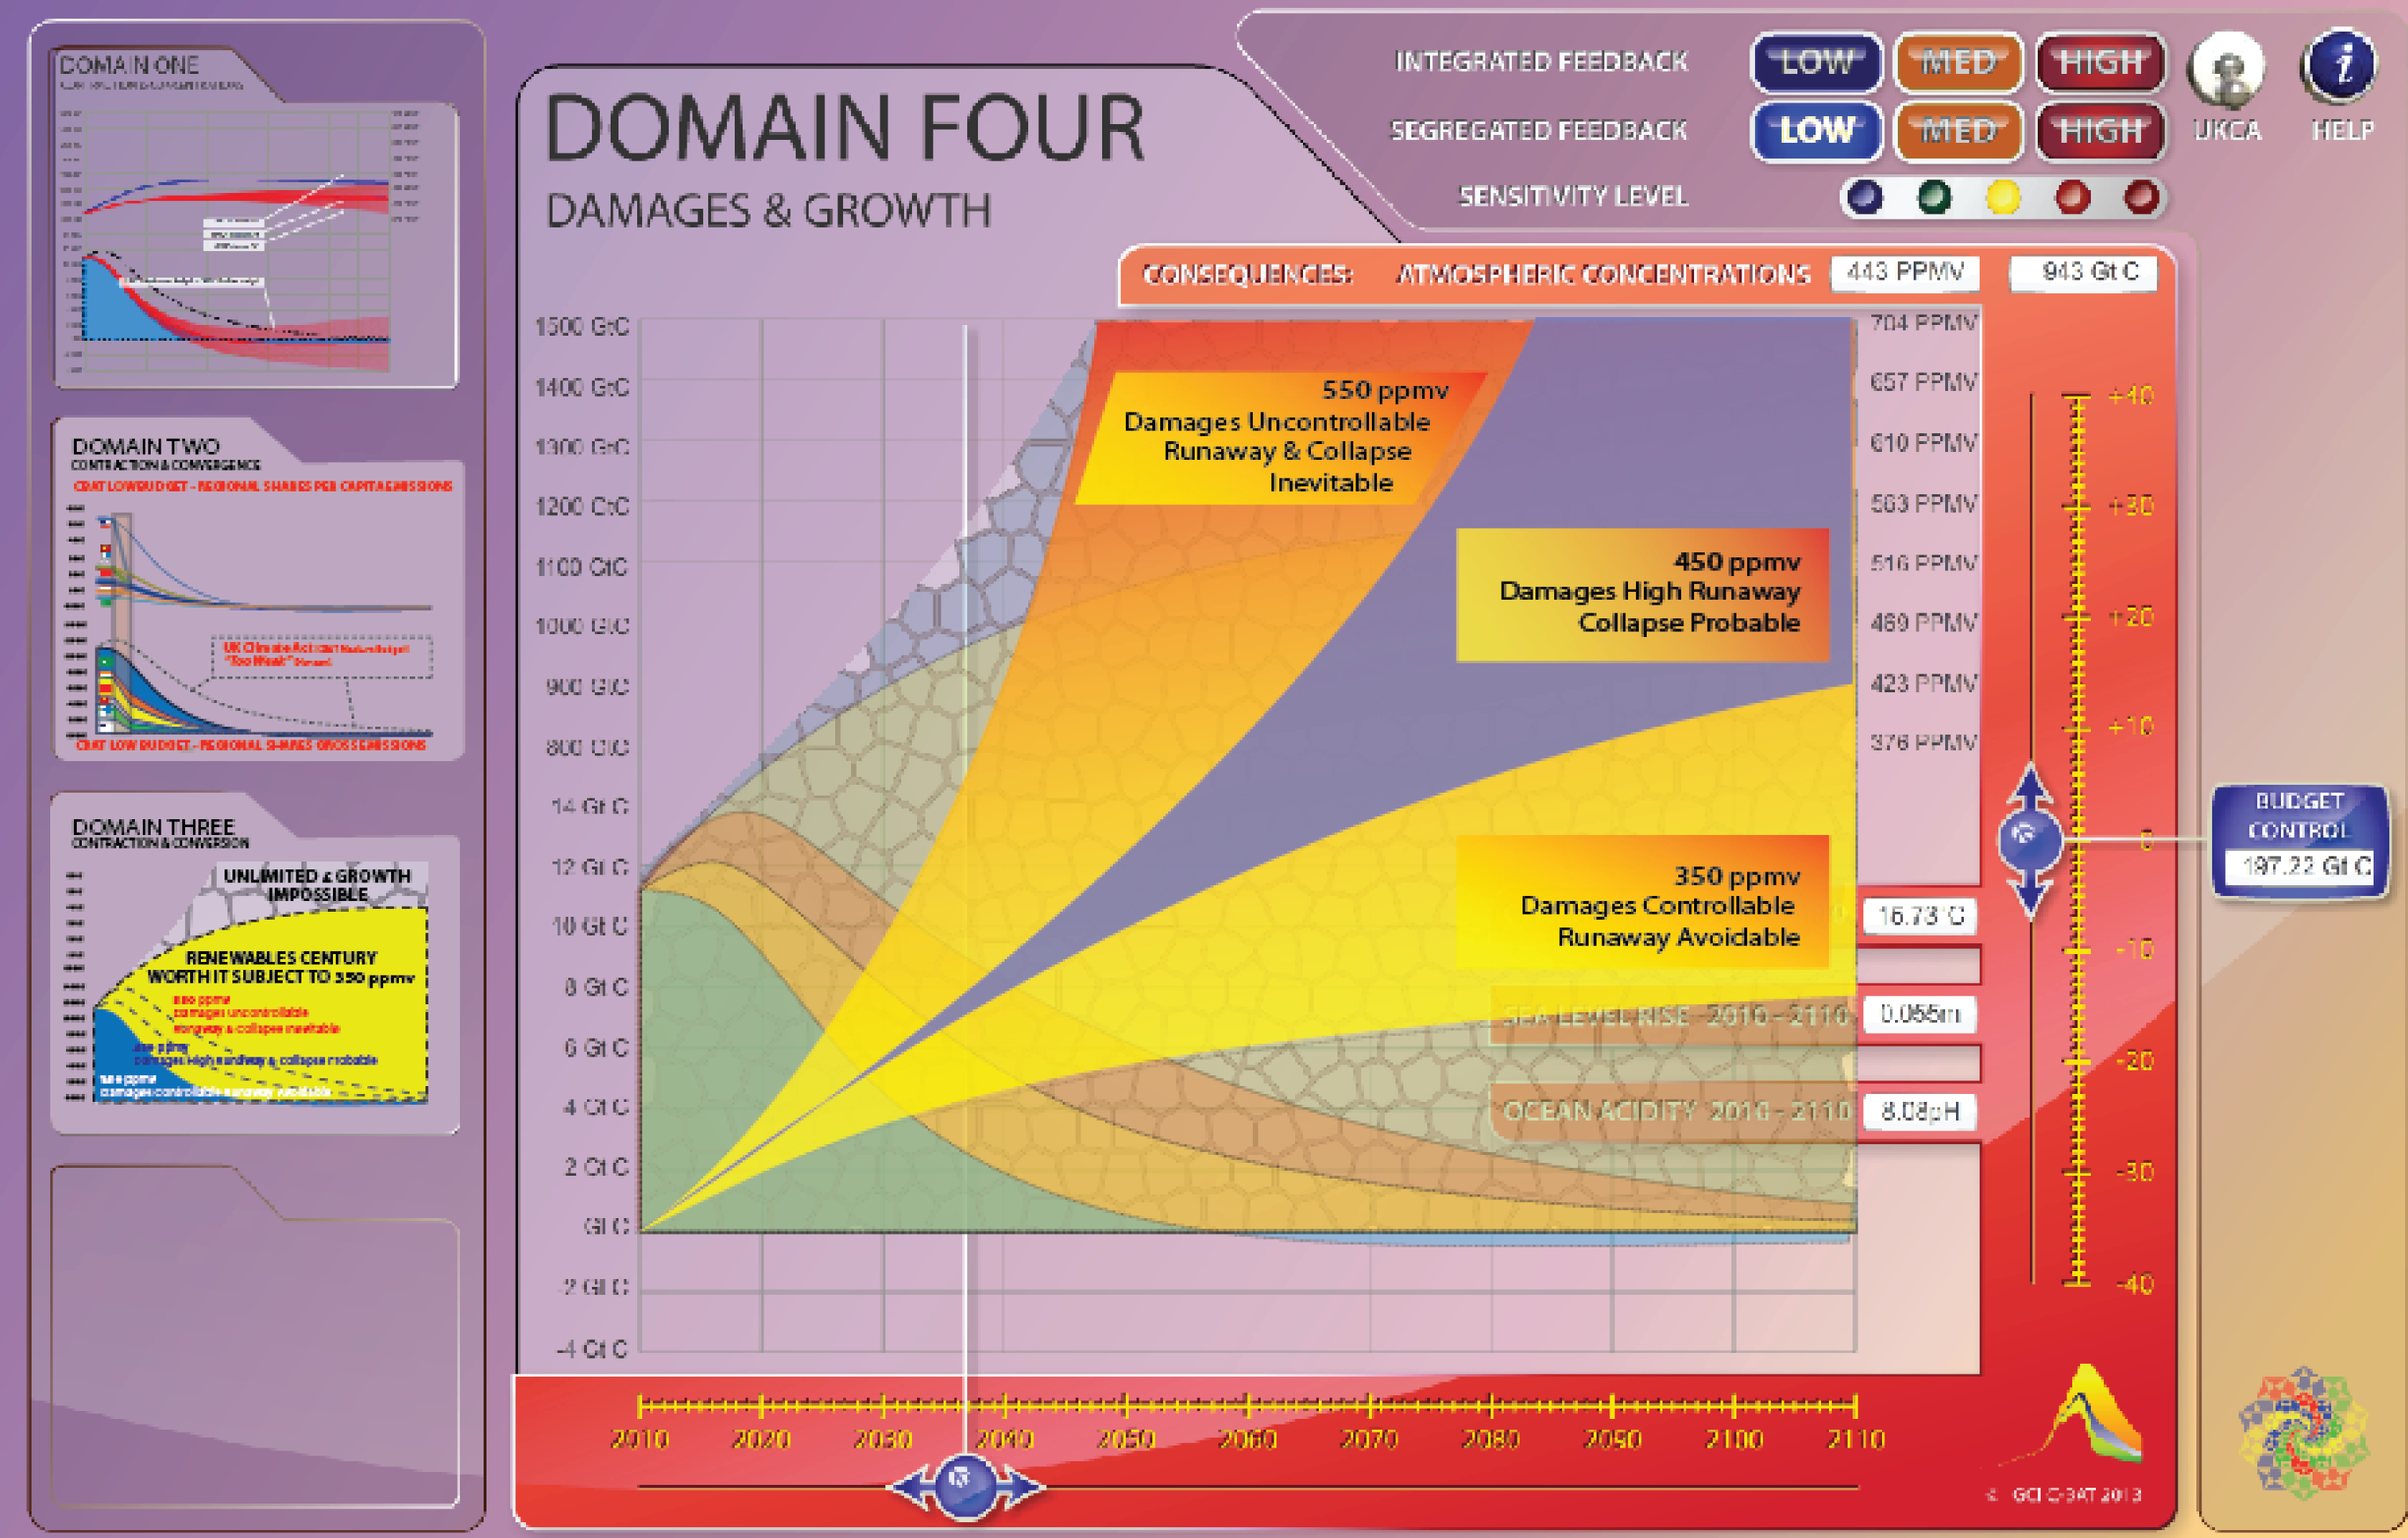
These values increase or decrease as use of the 'CBAT-Slider' shifts concentrations through 40 positions above and/or 40 positions below the 'Carbon-Budget' chosen.

They are values for the year 2110 and can be read in conjunction with the carbon-budget values, i.e. the total weight [or 'path-integrals'] of the carbon-budgets across the years 2010 to 2110. These 'carbon-budget' weight values [in Gt C] also change in the clock on the slider as this moved up and/or down.

CBAT user-choices of budget, slider-positions, feedback-type and climate-sensitivity level [1-5] with all these resultant 'clock-values' are shown in a transparent and rational account intended to help connect CBAT-user-budget-choices with their possible consequences.

2
BACK TO CBAT Graphic User Interface [GUI]


1
BACK TO ALL INFO POINTS DOMAIN 1

CBAT Graphic User Interface [GUI]
Only DOMAIN ONE animation working so far

Mouse-touch-click each little DOMAIN PANEL in LEFT-HAND margin to
'SWAP' to CENTRE-SCREEN position & see how full animation will work

Content on this page requires a newer version of Adobe Flash Player.

Get Adobe Flash player

CBAT GUI - FULL 4 DOMAIN MOCK-UP animations not working yet

1
2
3
4

CBAT - FULL 4 DOMAIN MOCK-UP

Some Responses to CBAT so far

Some Support for the Classic C&C Concept over the years.