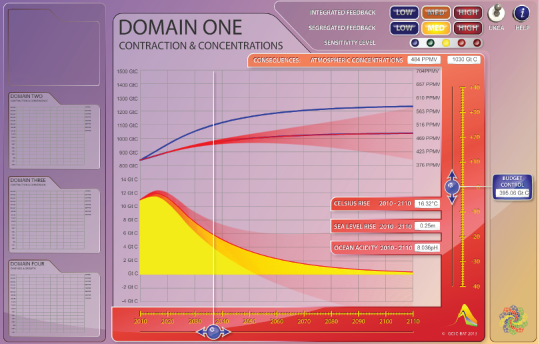
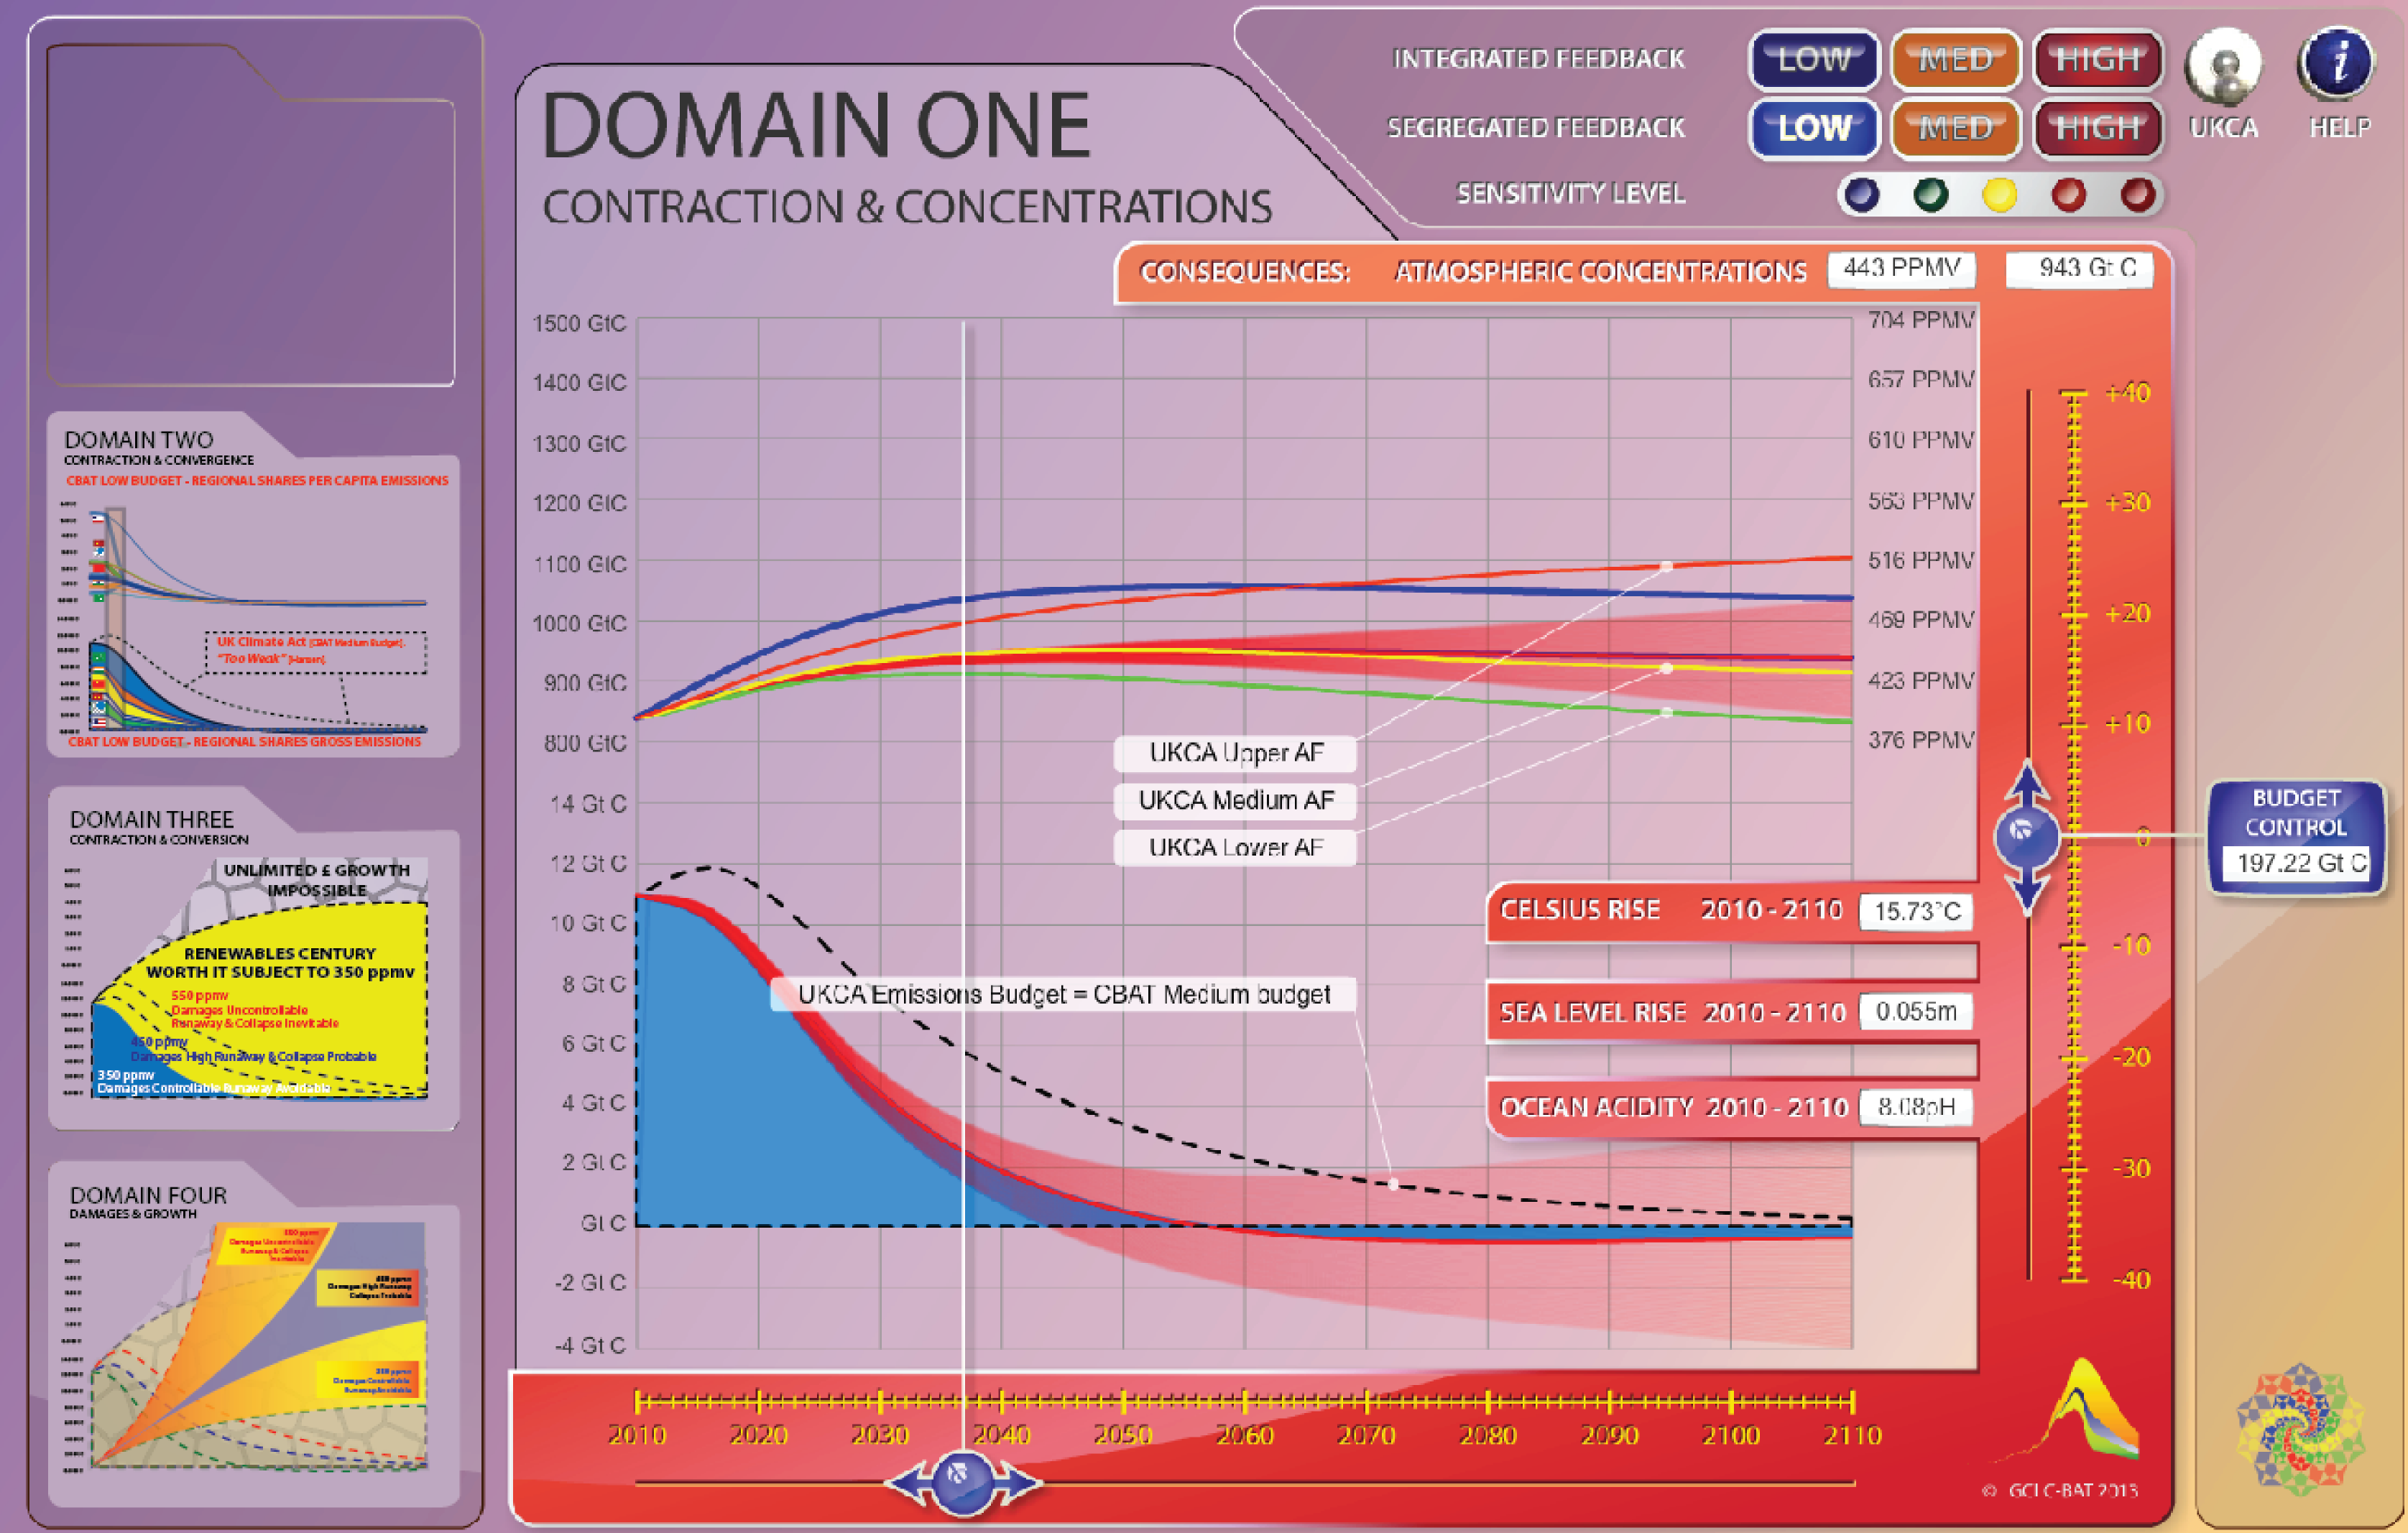
In CBAT, 'Constant Airborne Fractions' [CAF] of concentrations are drawn accumulating as: -
CAF 100% of emissions [upper blue line] and
CAF 50% of emissions [lower blue line].
CAF 50% reflects the observed average of retention over the passed Century as emission from human sources have risen raising atmospheric concentrations by one tonne for every two emitted. It is expected that in future, particularly due to changes in global average temperature, that this fraction will change.
In the CBAT 'Graphic User Interface' [GUI] CAF 50% & CAF 100% are shown as the 'pair' of coloured-lines appearing above each emissions-budget chosen.
In the following still image the: -
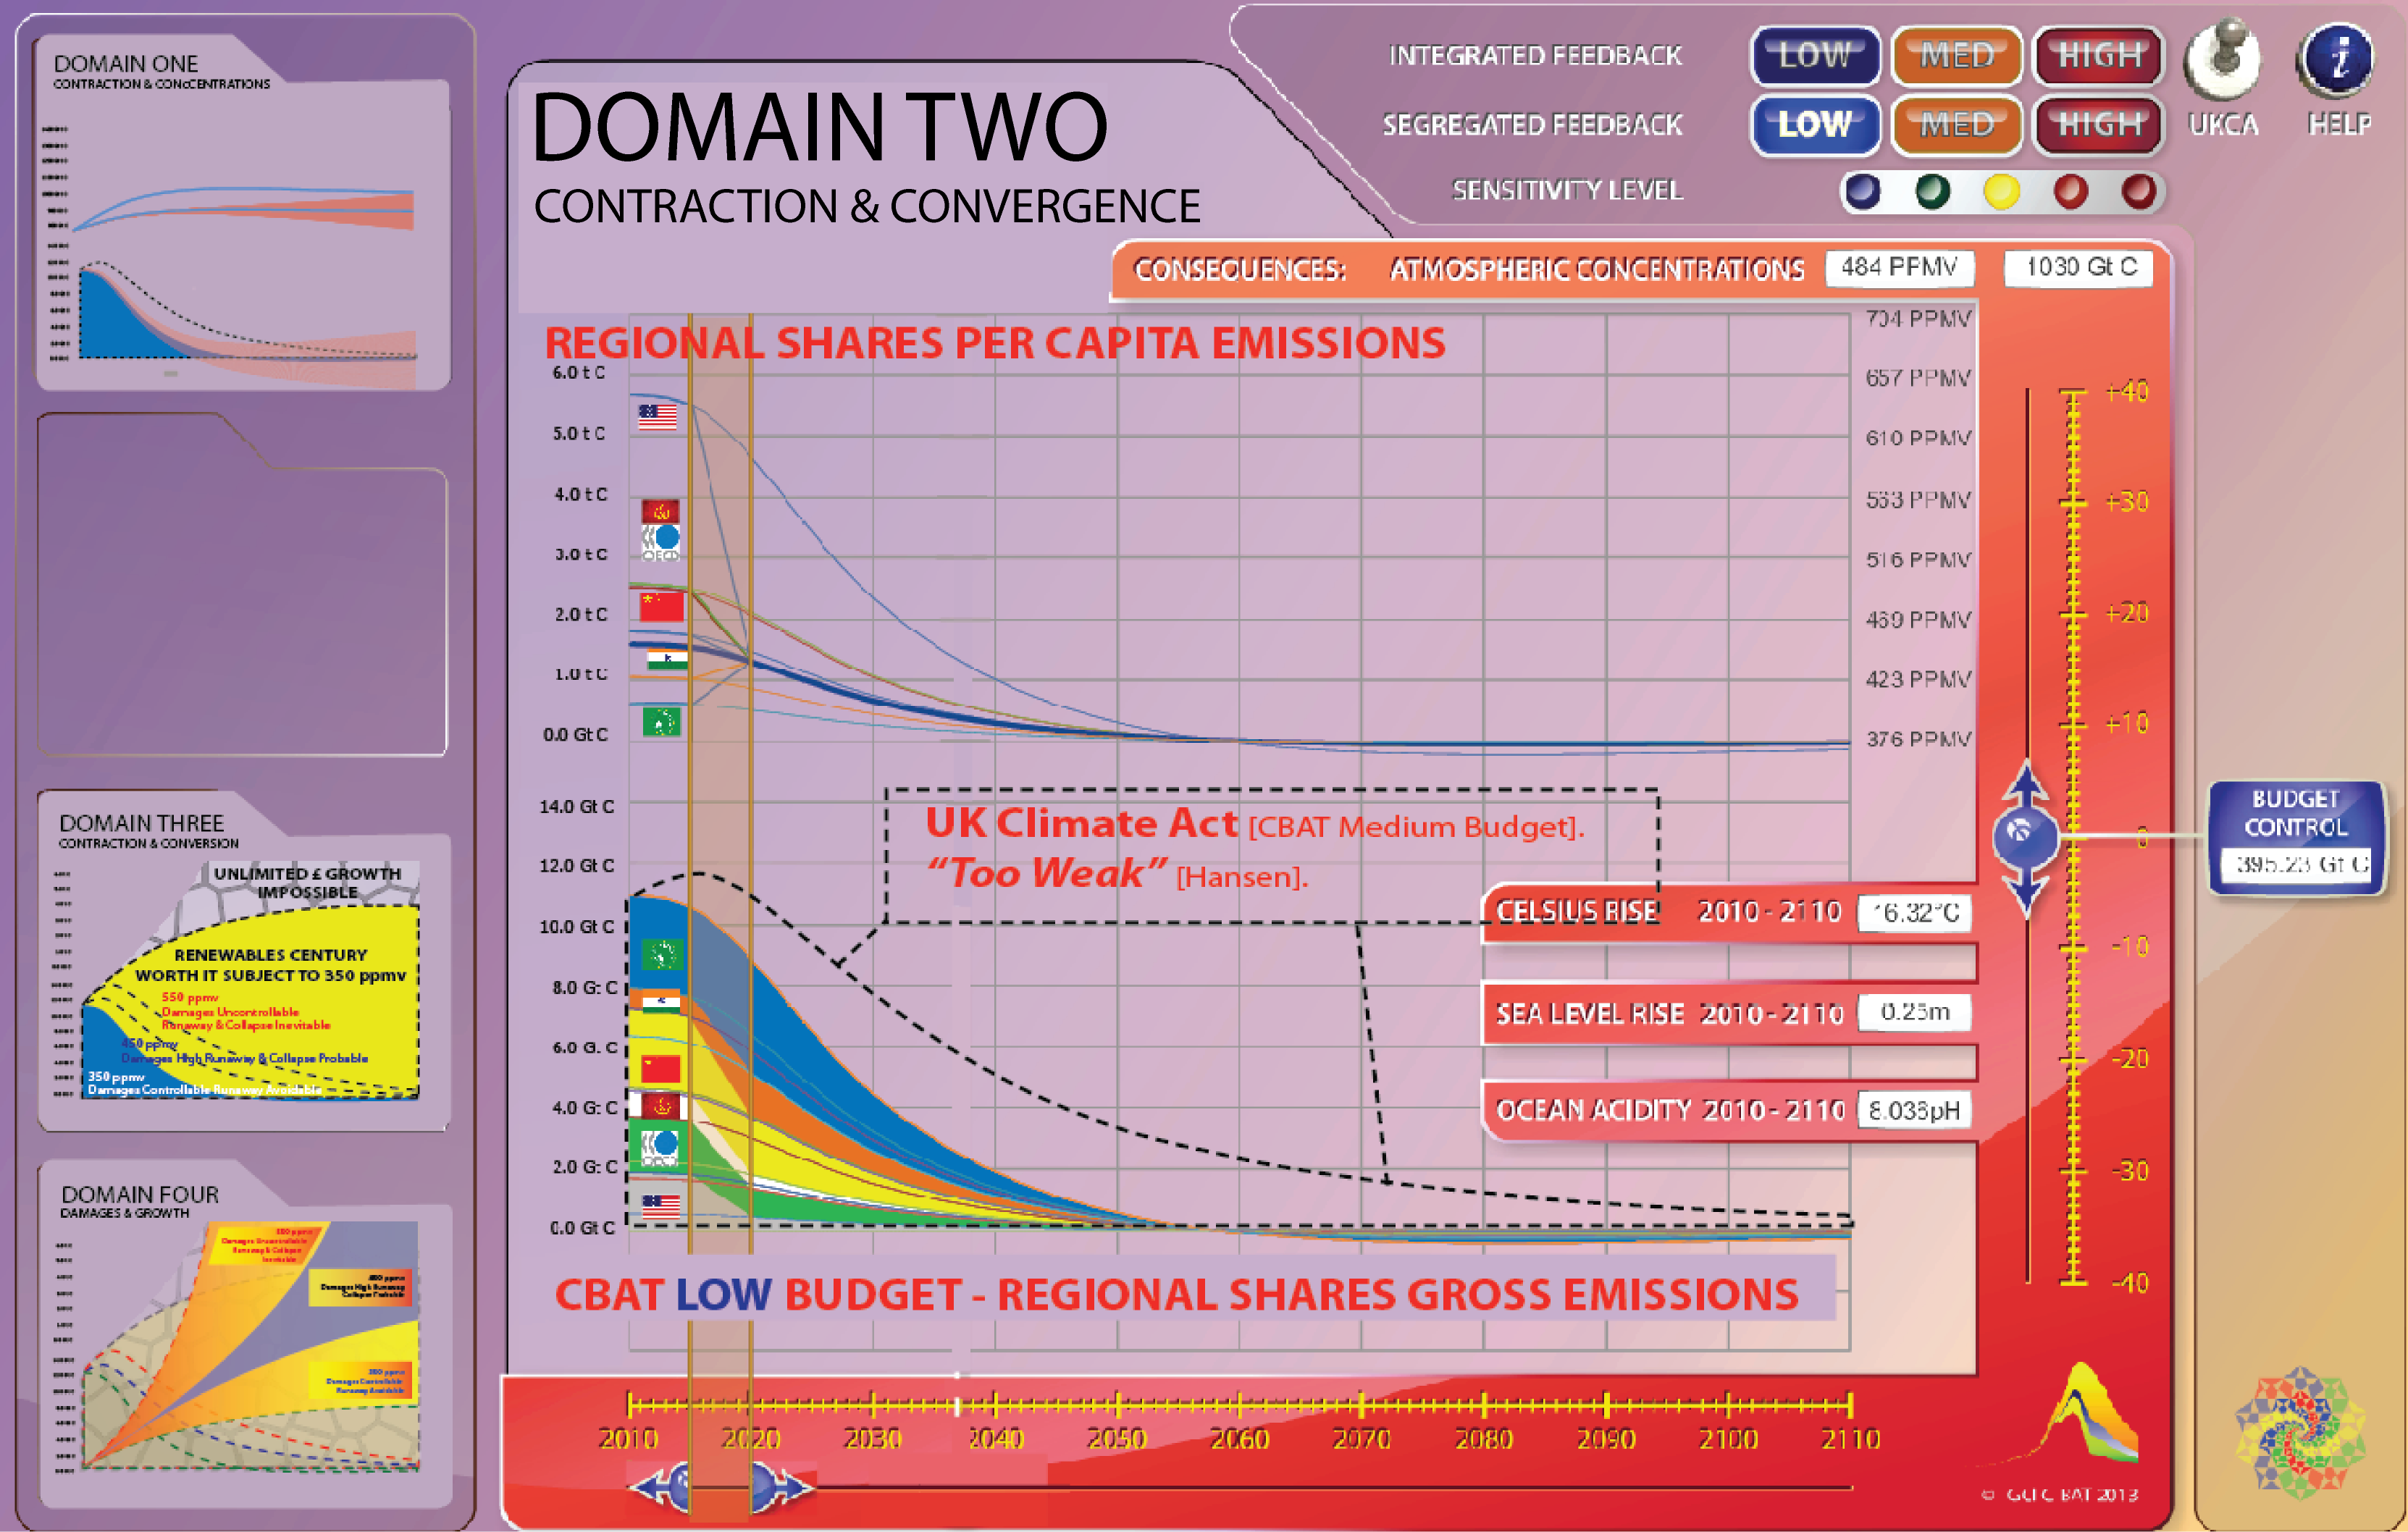
LOW Budget and the CAF lines are in BLUE
MEDIUM Budget and the CAF lines are in YELLOW
HIGH Budget and the CAF lines are in RED
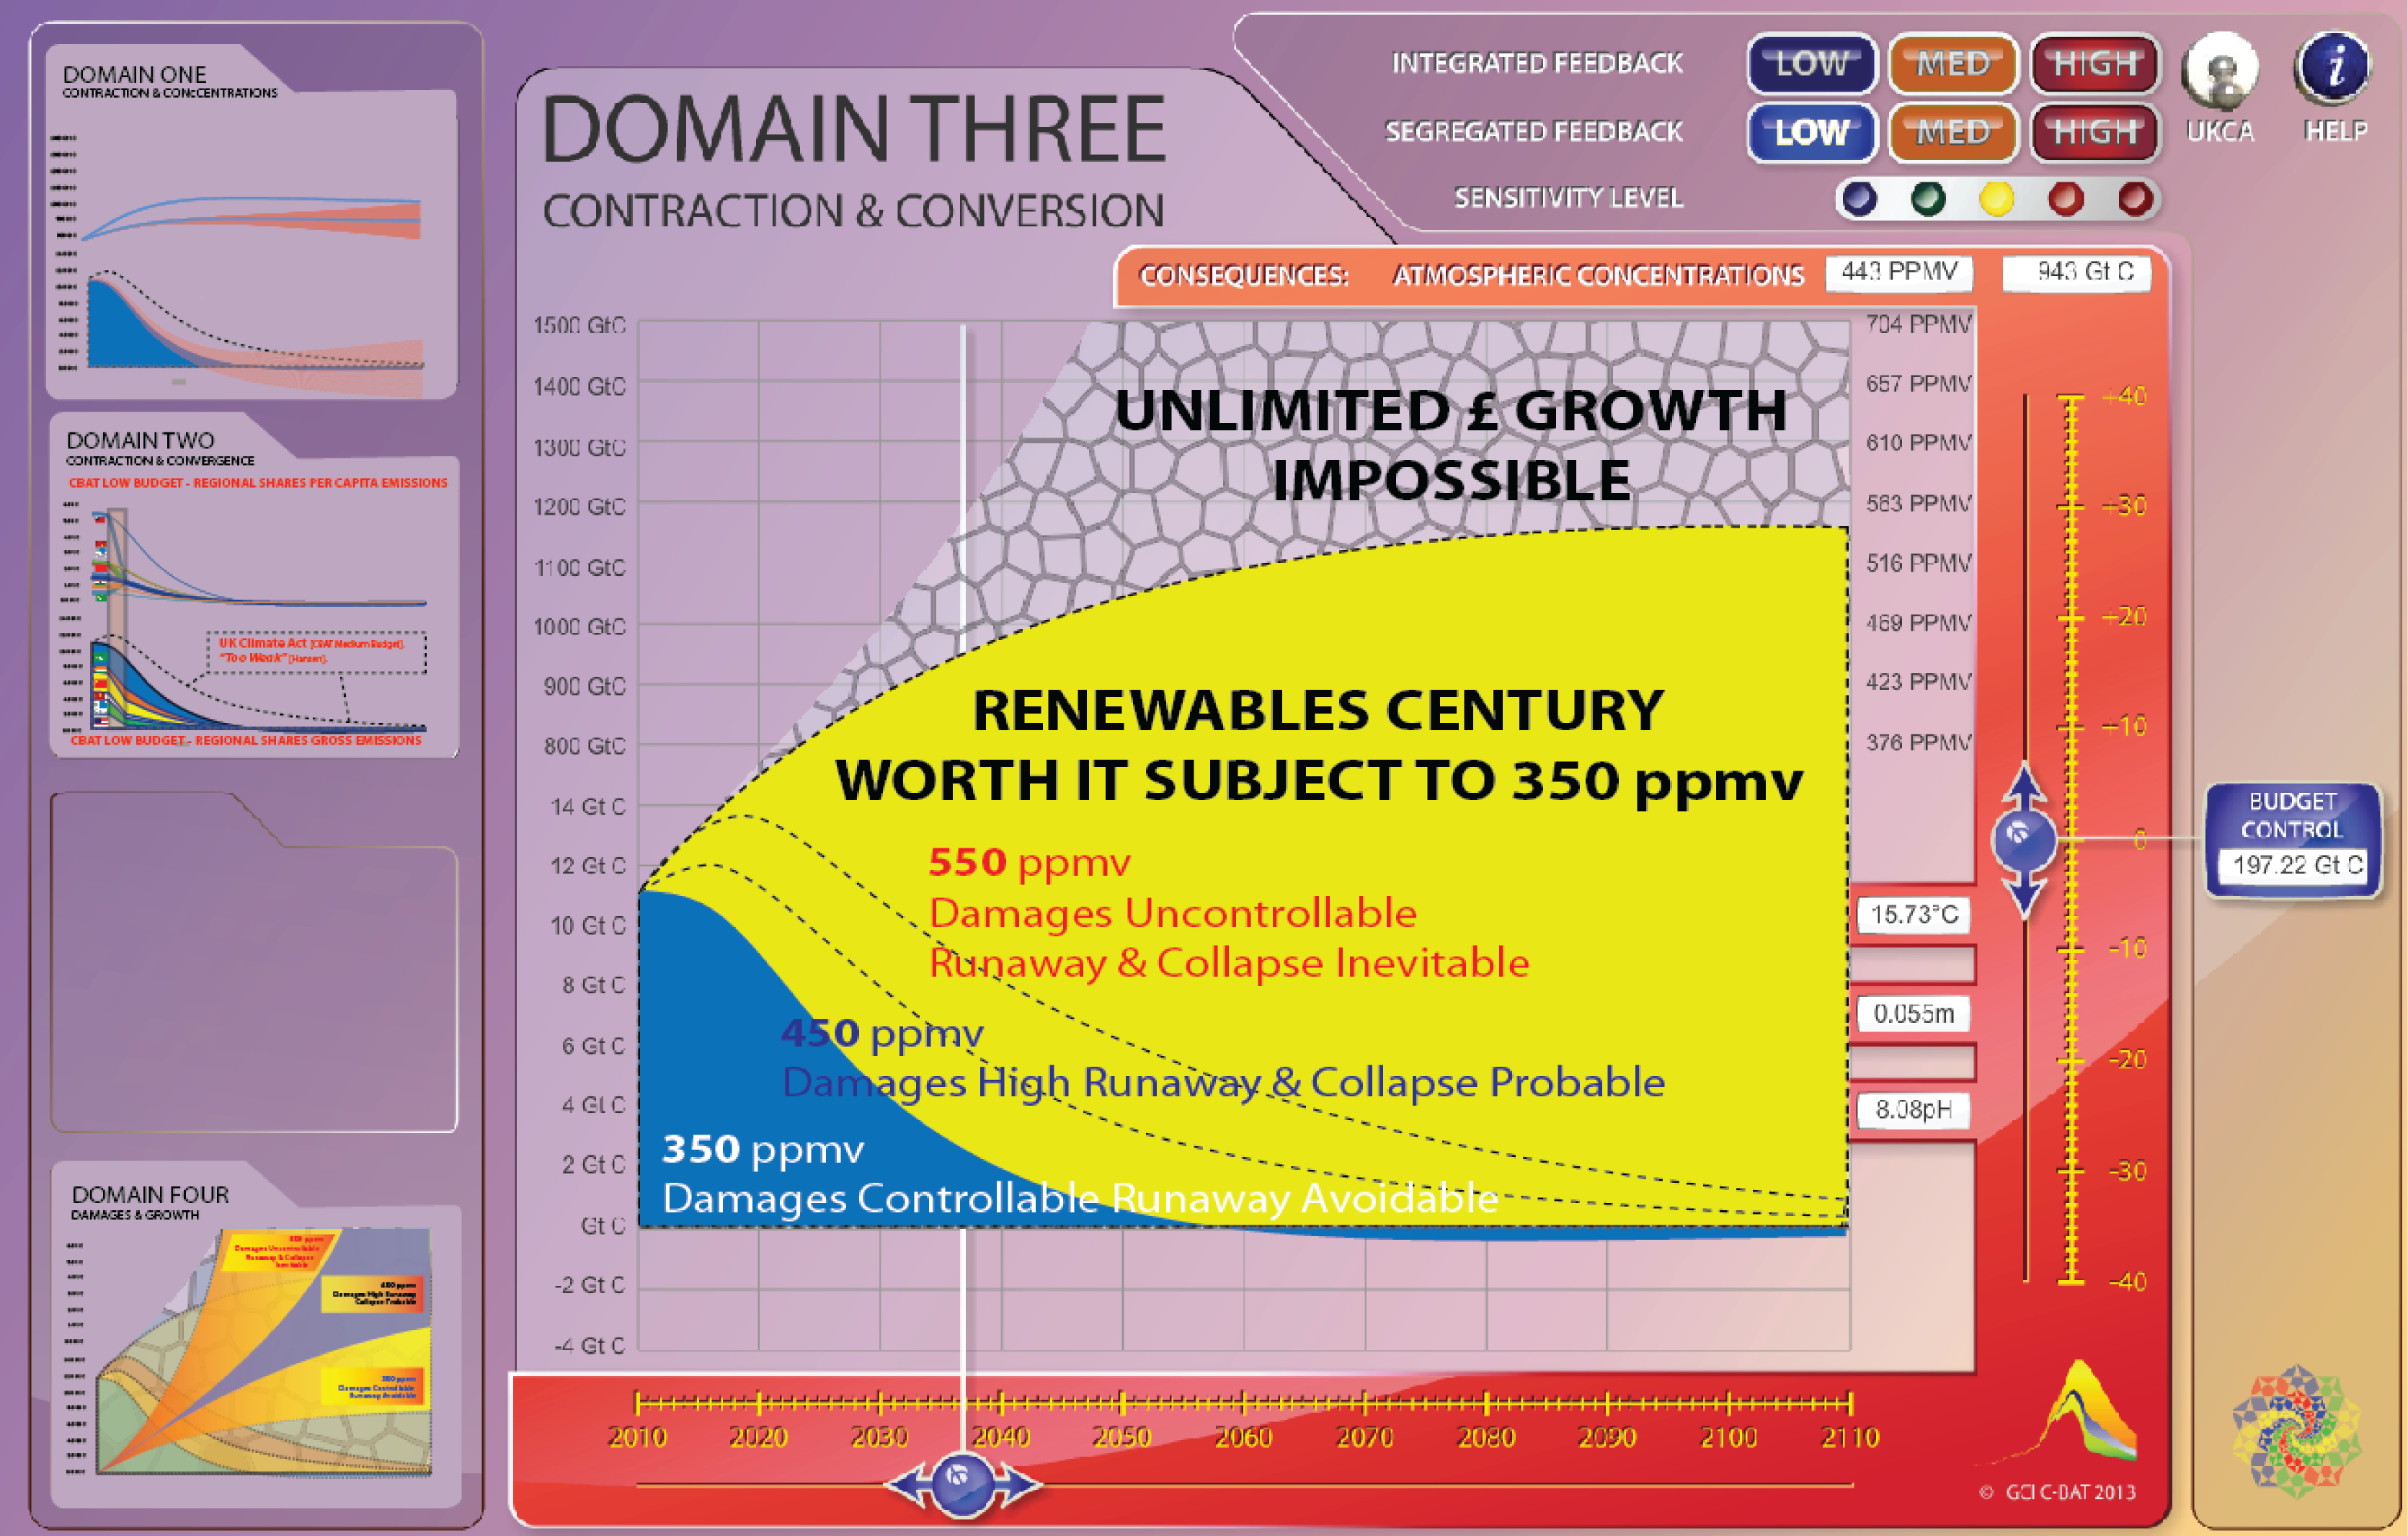
Showing CAF 100% and CAF 50% is to create a 'frame-of-reference' within which the array of concentration paths demonstrated over the three carbon budgets Low, Medium, High can be observed. These three are already in place in CBAT but within a future 100-year time-frame, any shape, weight, date-rate budget can be inserted into CBAT as an xml data-sheet and the model will recalculate from these.
Calculating and showing CAF this way makes it easier to understand and measure concentrations as a function of emissions and to scrutinze the 'emissions-source-sink' assumptions behind the output from 'climate-models' [such as from CBAT & UKMO for example].
When concentrations are greater than CAF 50%, it shows they will continue to rise even when budget-emissions fall to zero.
When concentrations are less than CAF 50%, it shows they will fall even while budget emissions are still falling. This is the position that the UKMO claims with the UK Climate Act, where [in their 'Median' scenario] CO2 concentrations are portrayed as falling after 2050.
A simple bath-tap-plug animation is here as an analogy to illustrate this stock-flow relationship.
This fall is only theoretically possible as long as all the potential for separately identified and measured positive-feedback-emissions [from melting permafrost for example] are omitted from the climate-model.
The UKMO eventually admitted a range of these crucial emissions had been omitted from their climate-model in 2009/10.
WHAT WE DON'T KNOW
The 'knowledge-context' for this is that no-one - including 'climate-modellers' - knows with certainty how to forecast, let-alone measure this emissions:concentrations future.
This is because it is the future and so by definition it has happened yet, where we don't know the: -
future path-integral of human 'budget-emissions'
future path-integral of a range of 'feedback-emissions'
future rate at which, whatever that mix may be, it is going to add-up in atmosphere
extent of future temperature-rise that is triggered by that or the
extent to which all these effects will inter-act and potentially accelerate the whole process of 'climate-change' into a measurement-challenge that becomes virtually guessing how fast that change rate may become.
The real point is the need for climate policy based on the precautionary principle, as once under way - if this 'Rapid Inter-Active Feedback Effect' takes hold - there is nothing humans can do to stop it.
WHAT WE DO KNOW
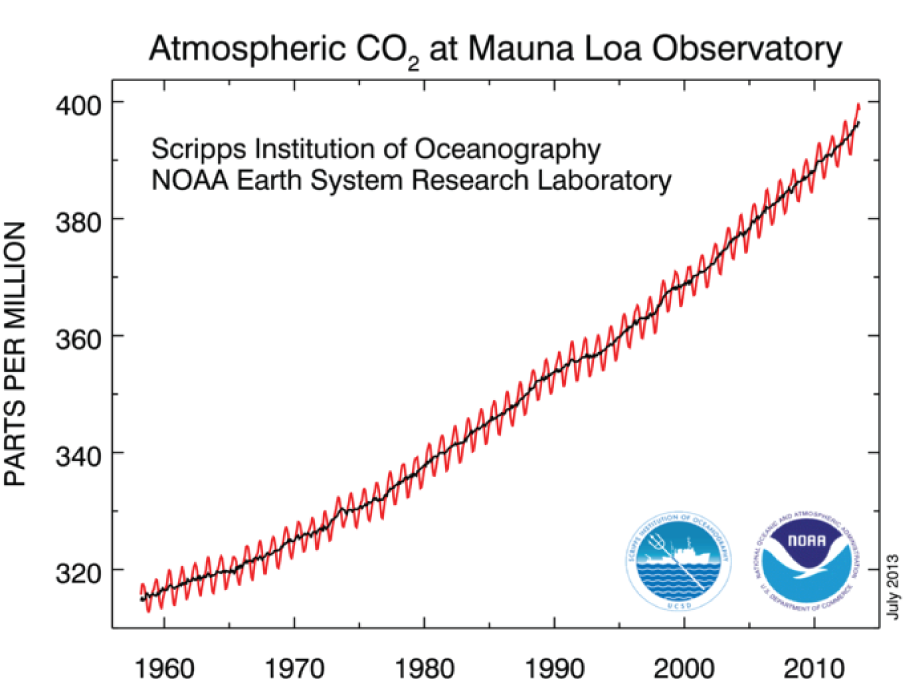
What we do know is that atmospheric CO2 concentrations have been rising from ~ 280 PPMV since 1800 in response to fossil fuel burning. We also know courtesy of Scripps NOAA data records since 1958 that this rise has continued exponentially from 315 PPMV in 1958 to 400 PPMV in 2013.
We also know that this whole range of rise is higher than anything in the ice-core records we now have going back around 1,000,000 years.
We also know that the historical trend average of the 'Airborne Fraction' of Emissions since 1800 has been 'Constant' at around 50%.