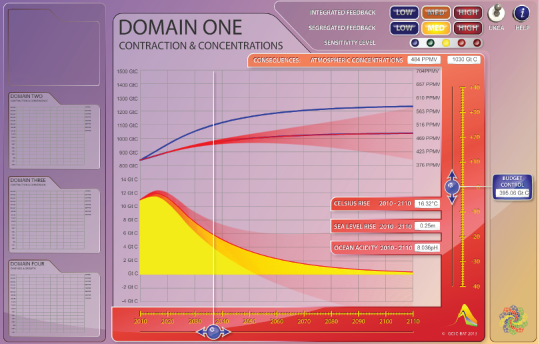
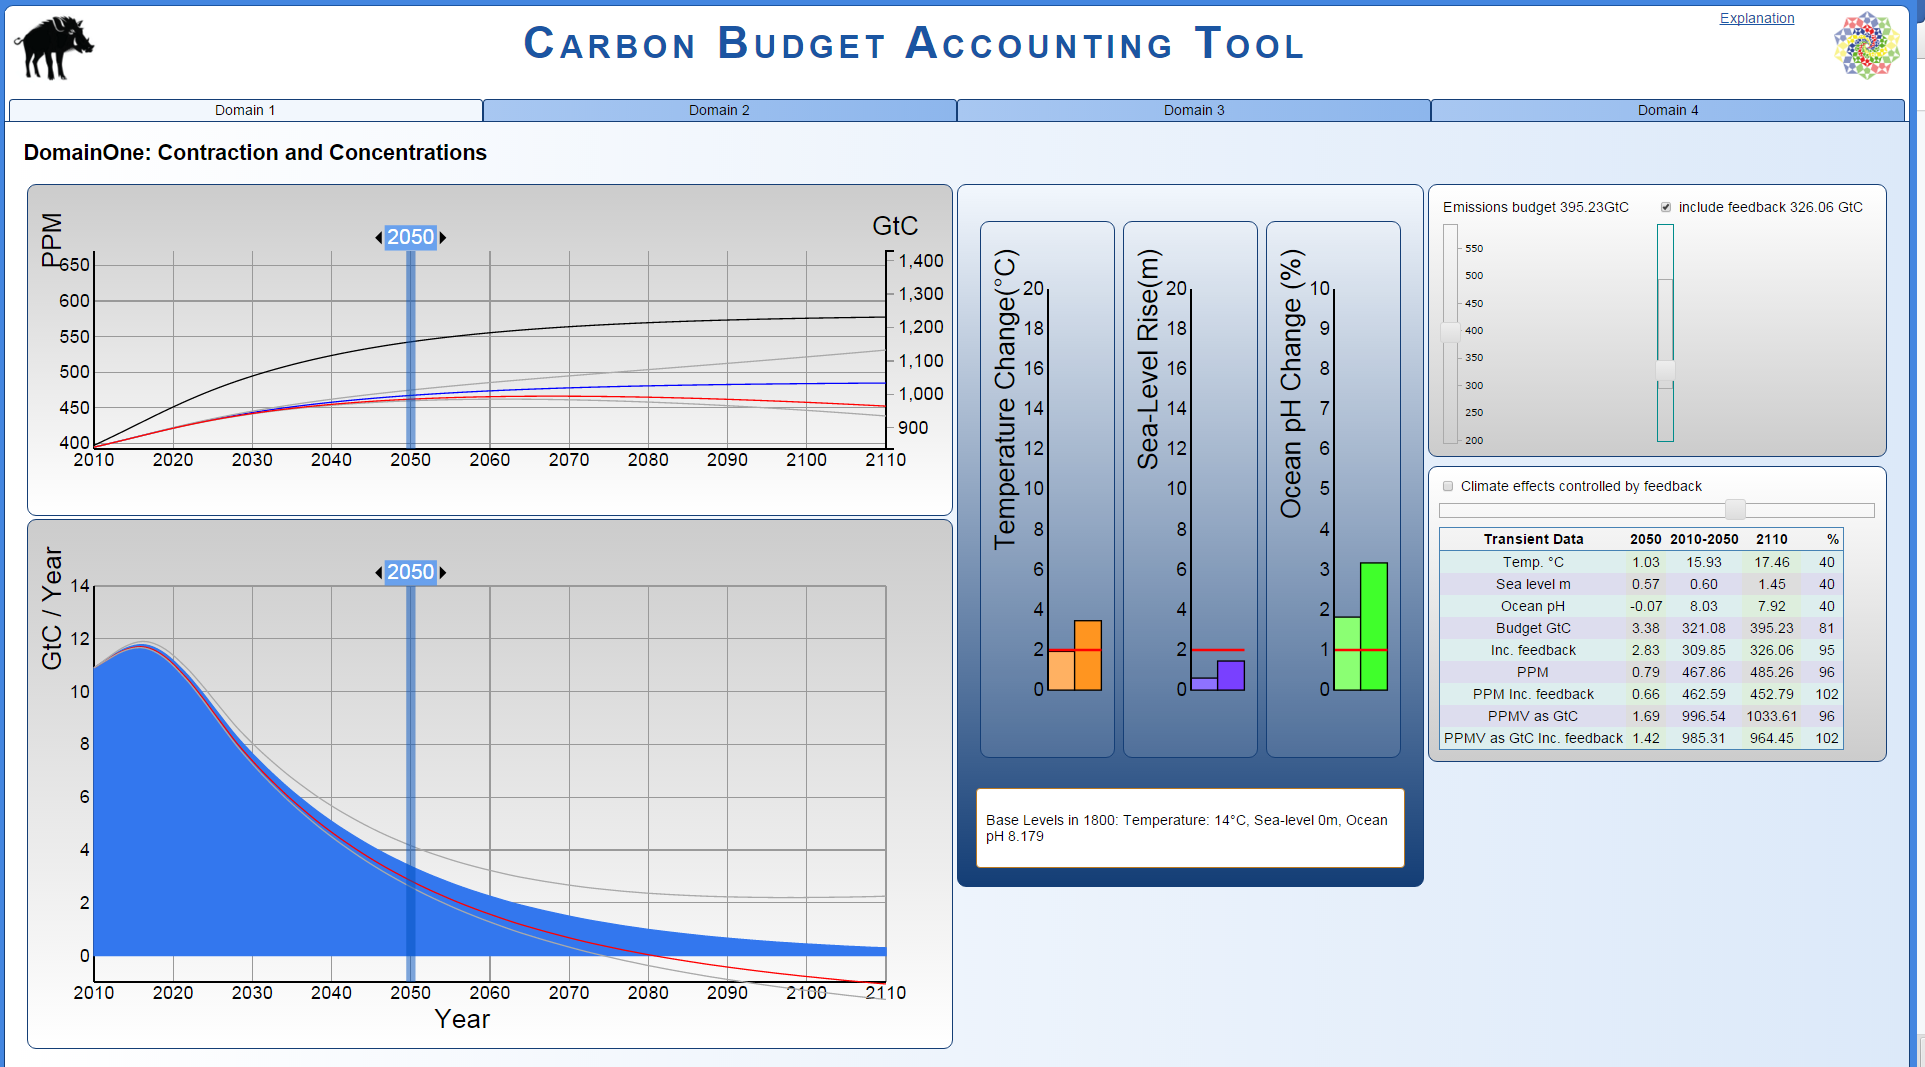
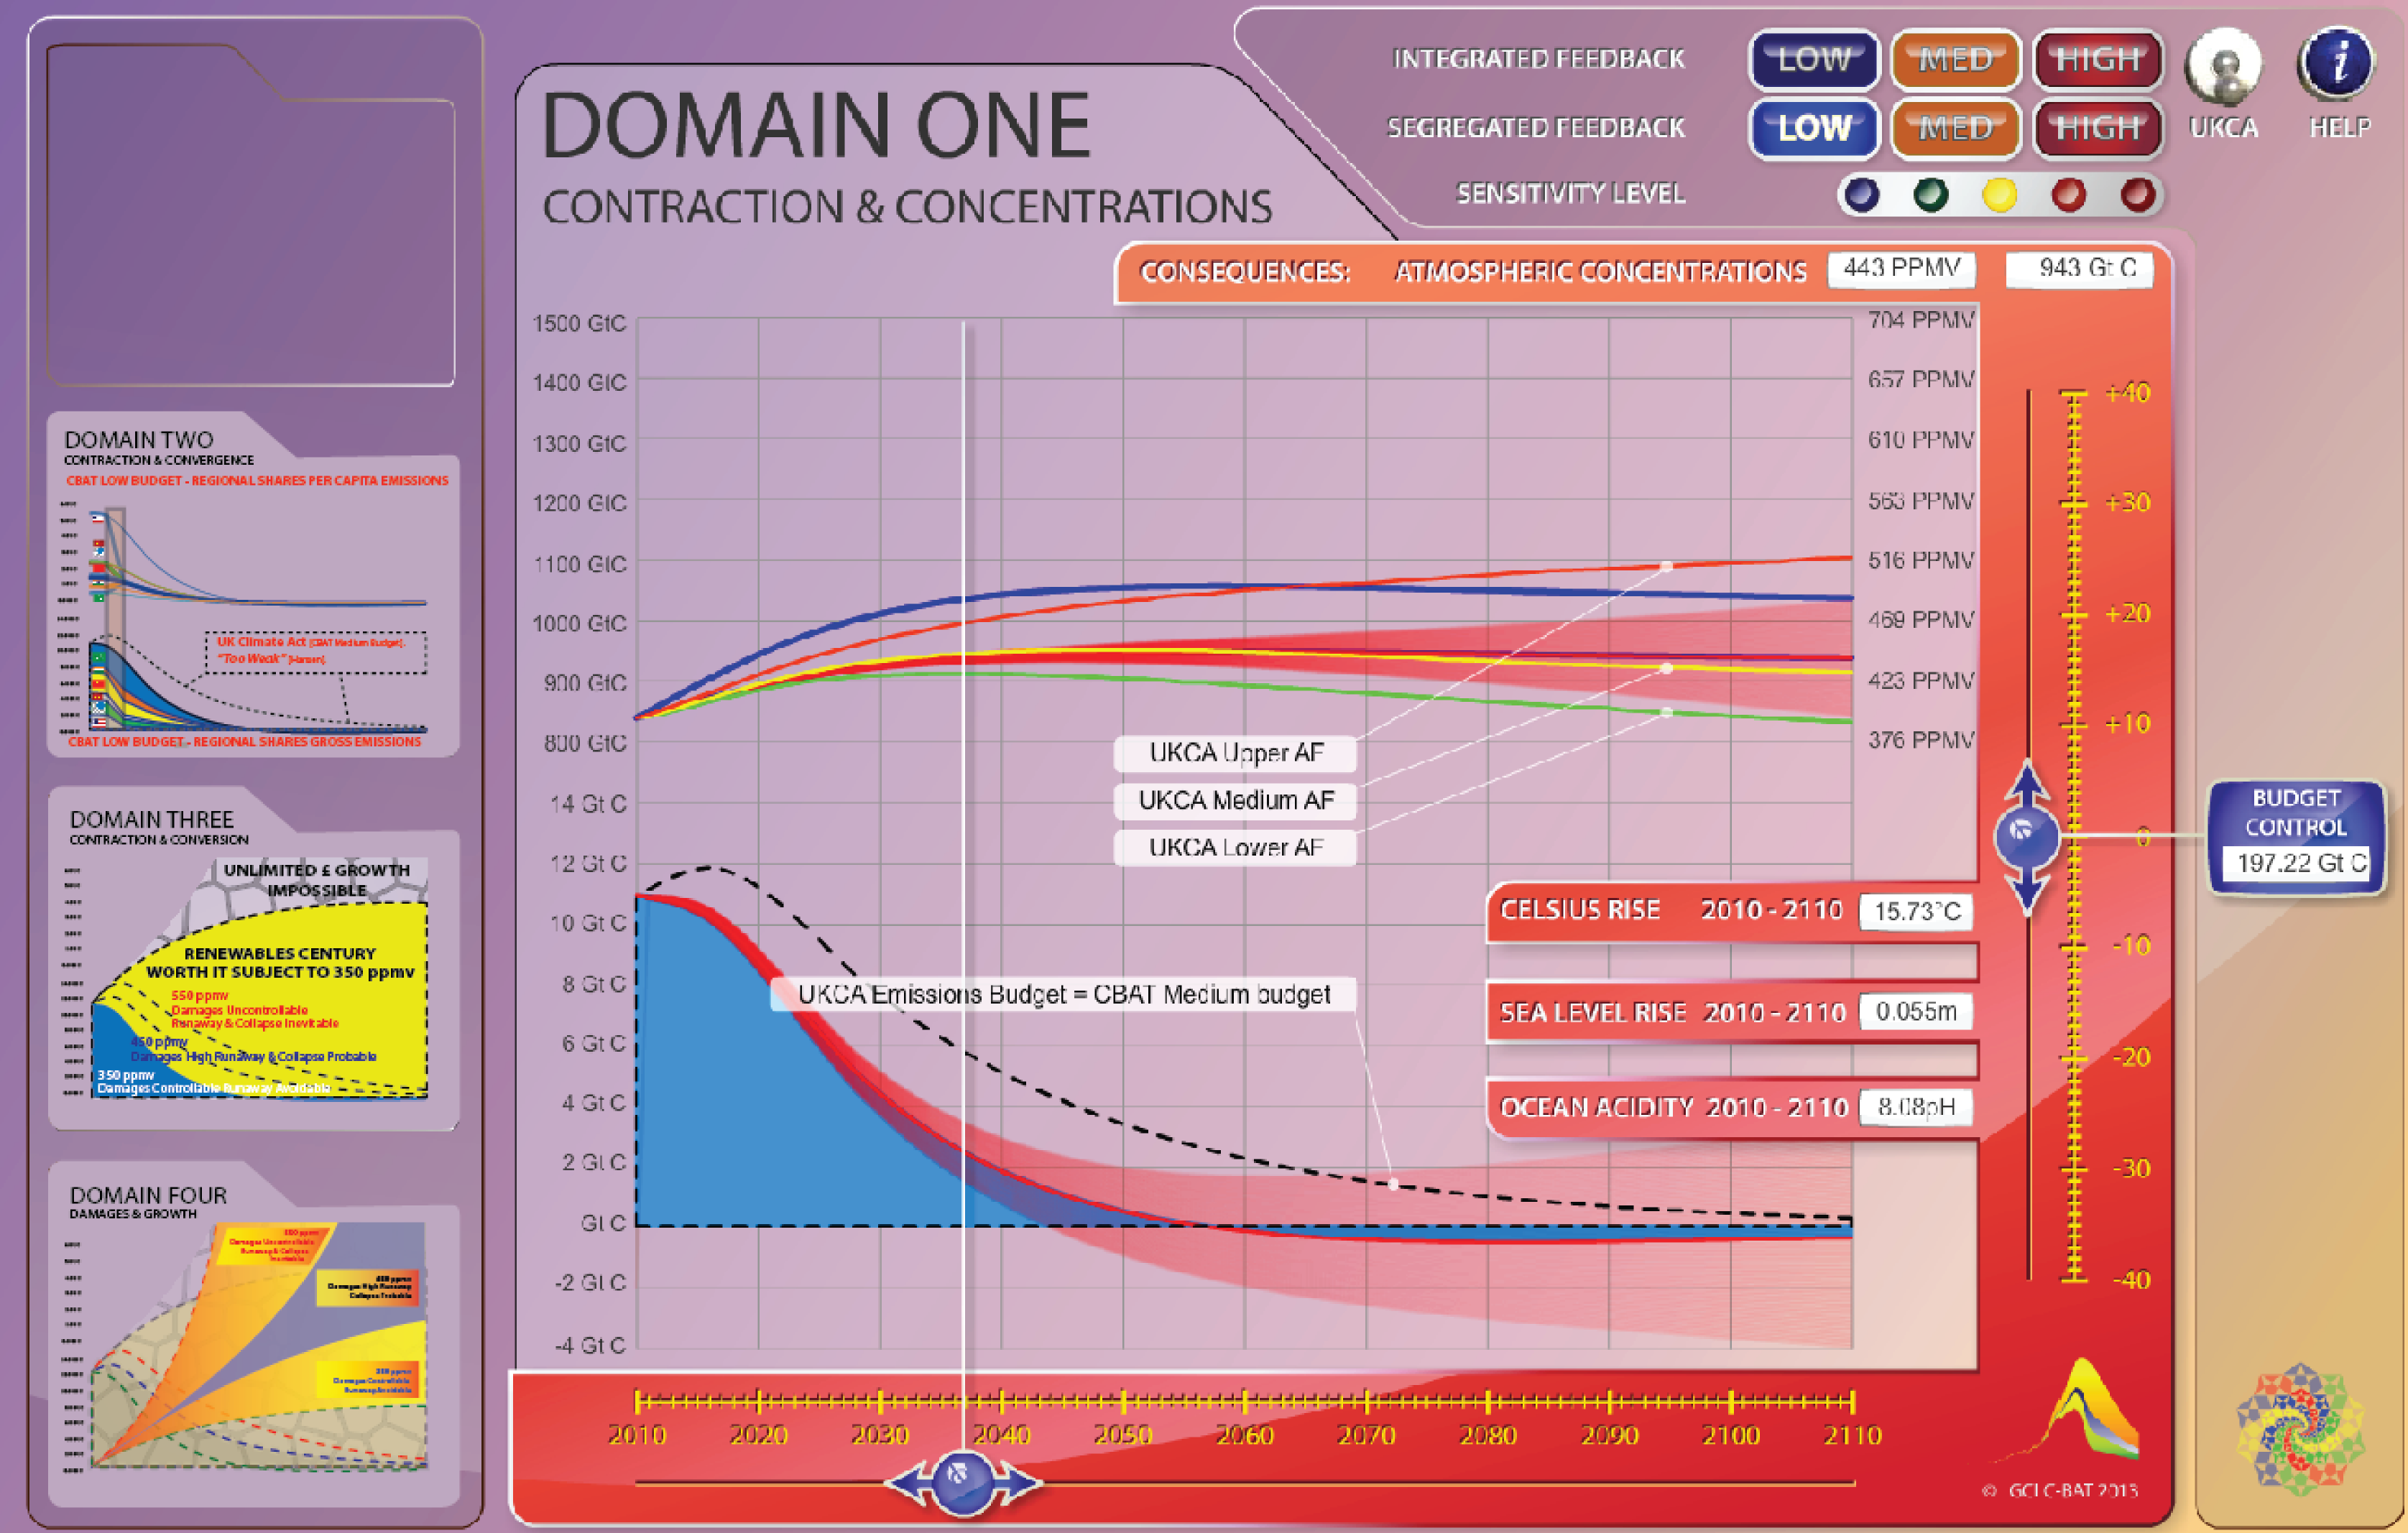
Use of the 'Slider-Control' shifts carbon-budgets through 40 positions upwards and 40 positions downwards above and below the 'Carbon-Budget' chosen from LOW MEDIUM & HIGH.
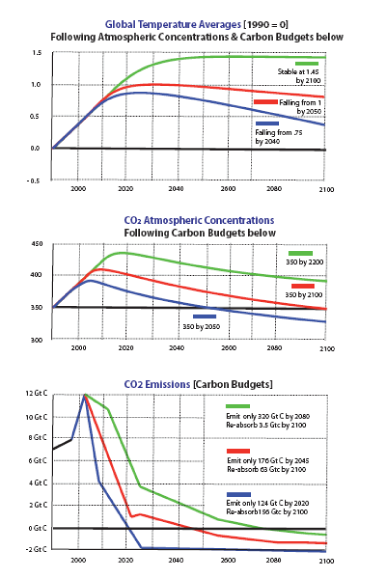
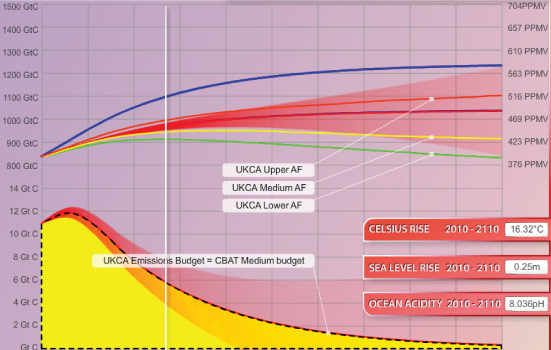
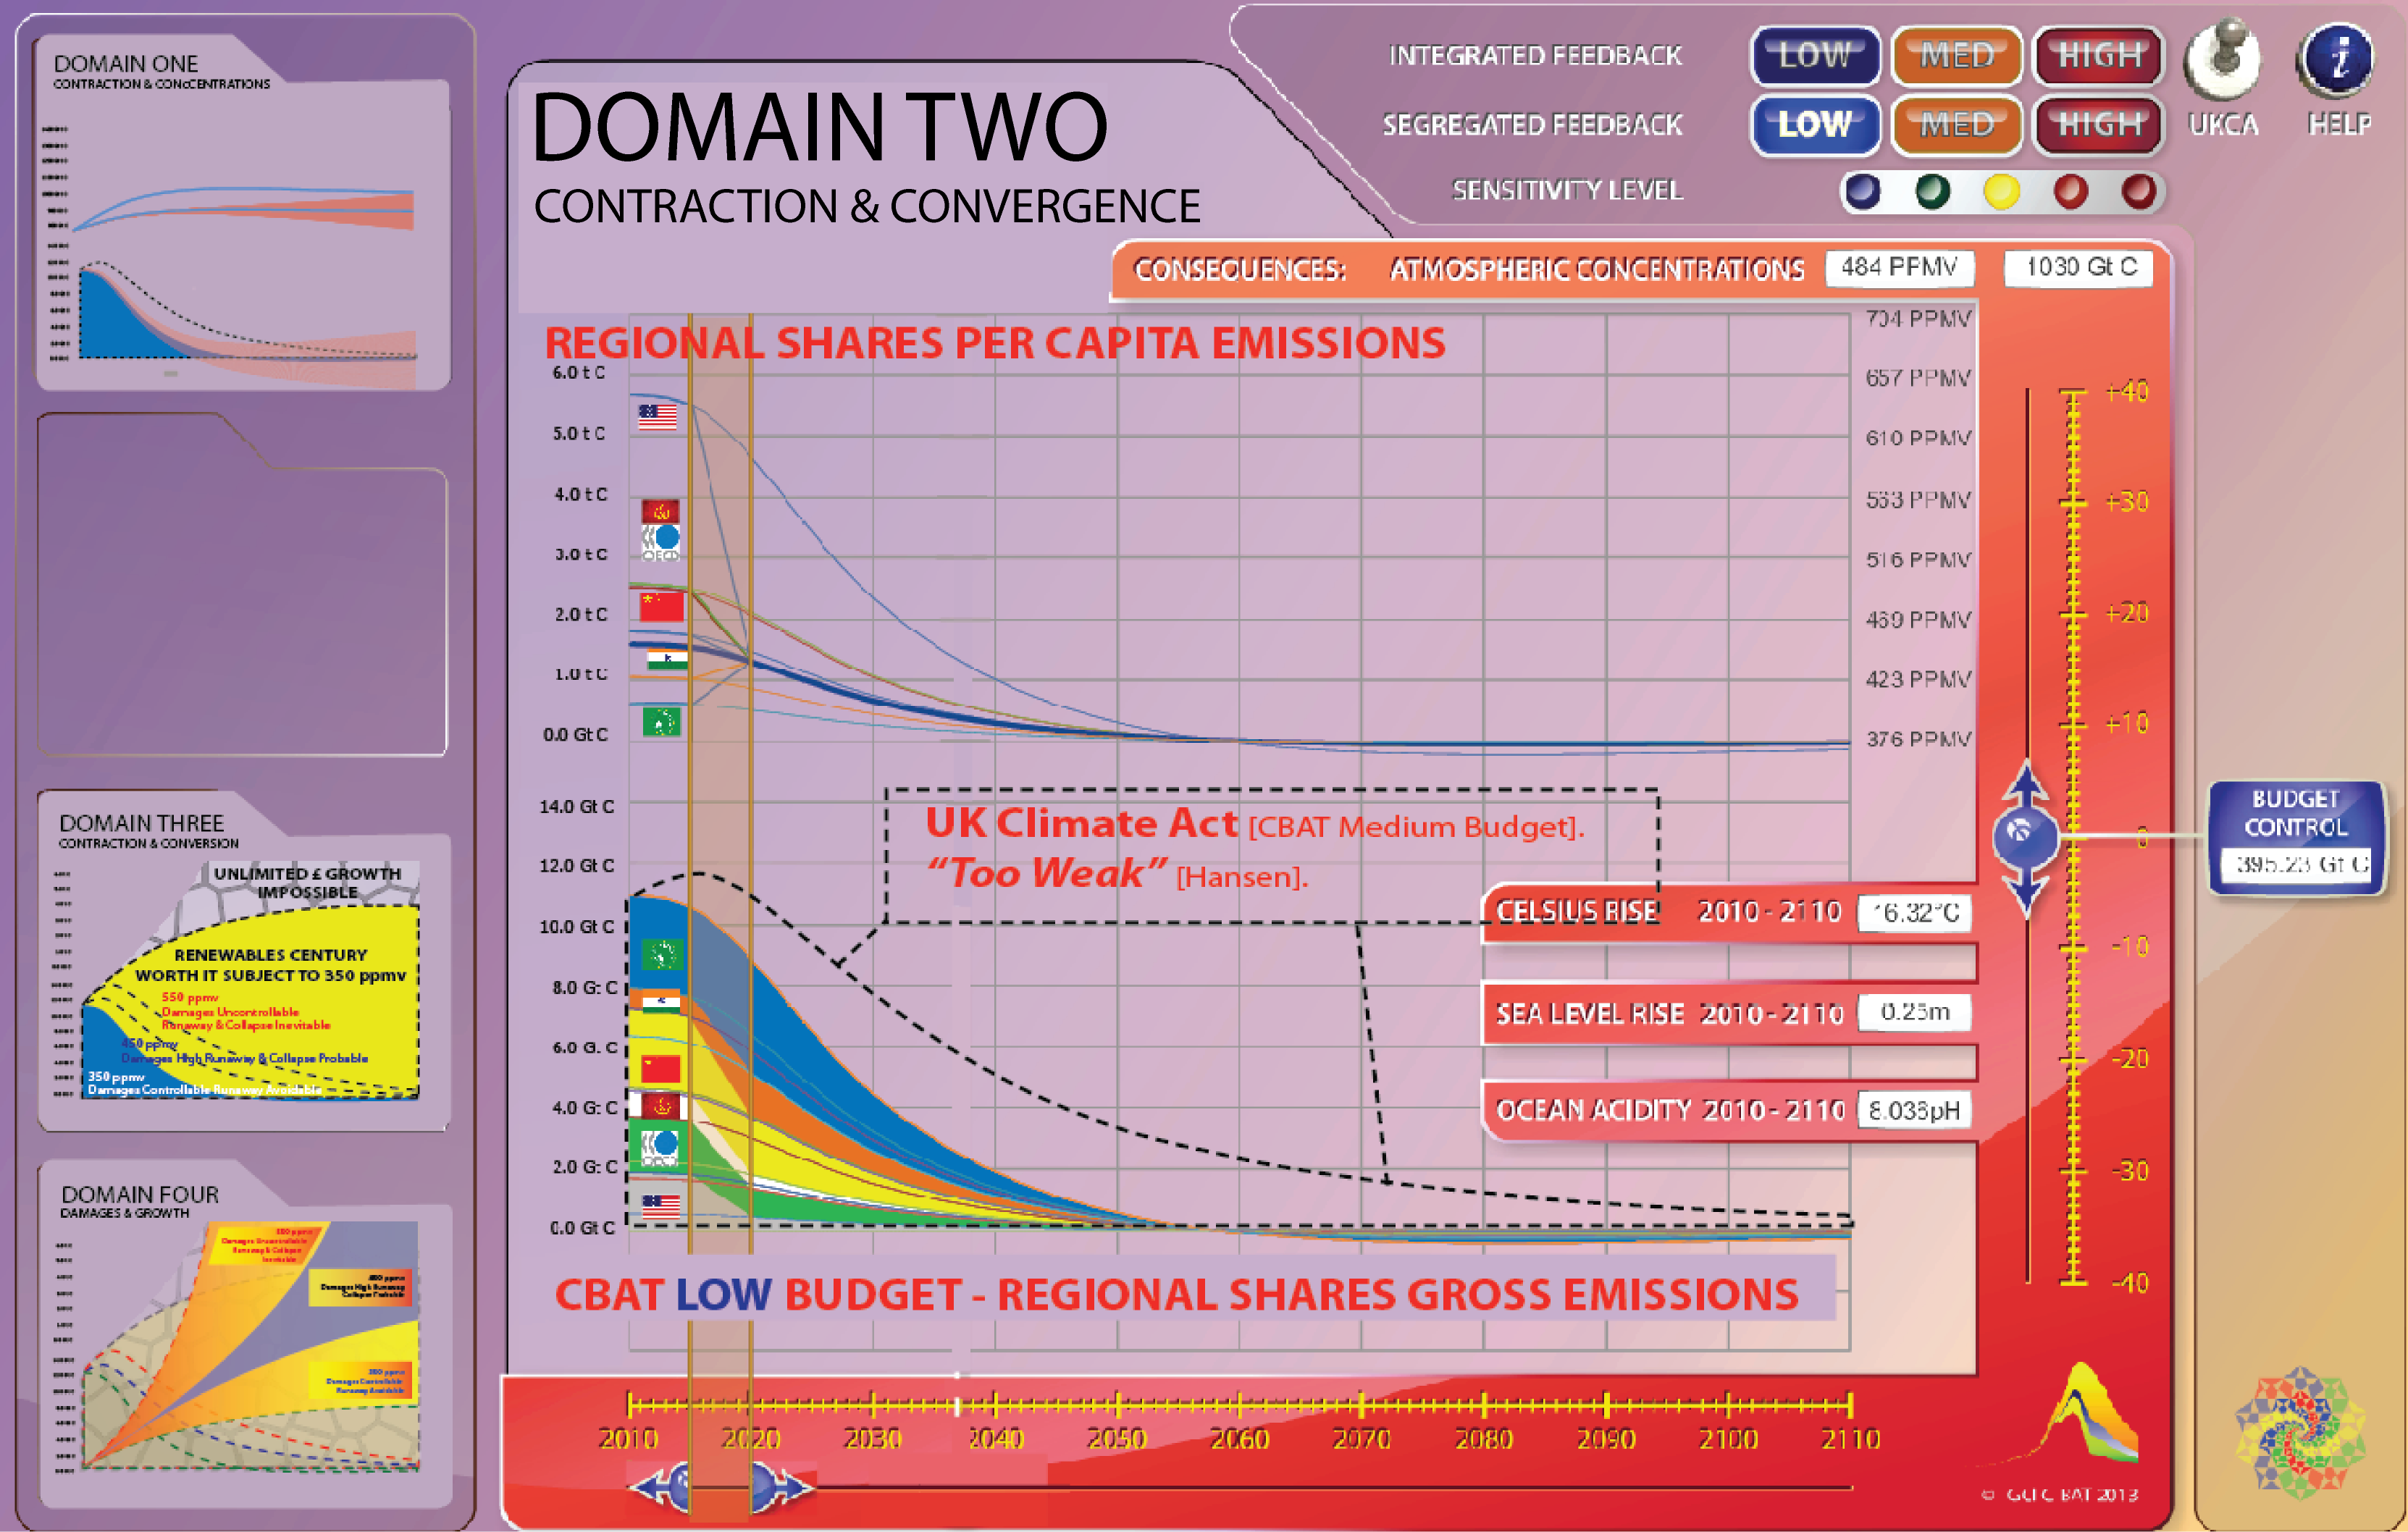
The first point is no-one actually knows where human emissions are going to go. The second point is that any 'Carbon-Budget' is merely a human-policy-construct. As shown here, following the climate-model behind the UK Climate Act such a budget does not necessarily reflect the total of emissions that will occur even if this policy-budget is theoretically 'implemented' in full internationally.
This is because a range of feedback-emissions/effects consequent on temperature rise will occur and significant examples of these were omitted from the UKMO's model.
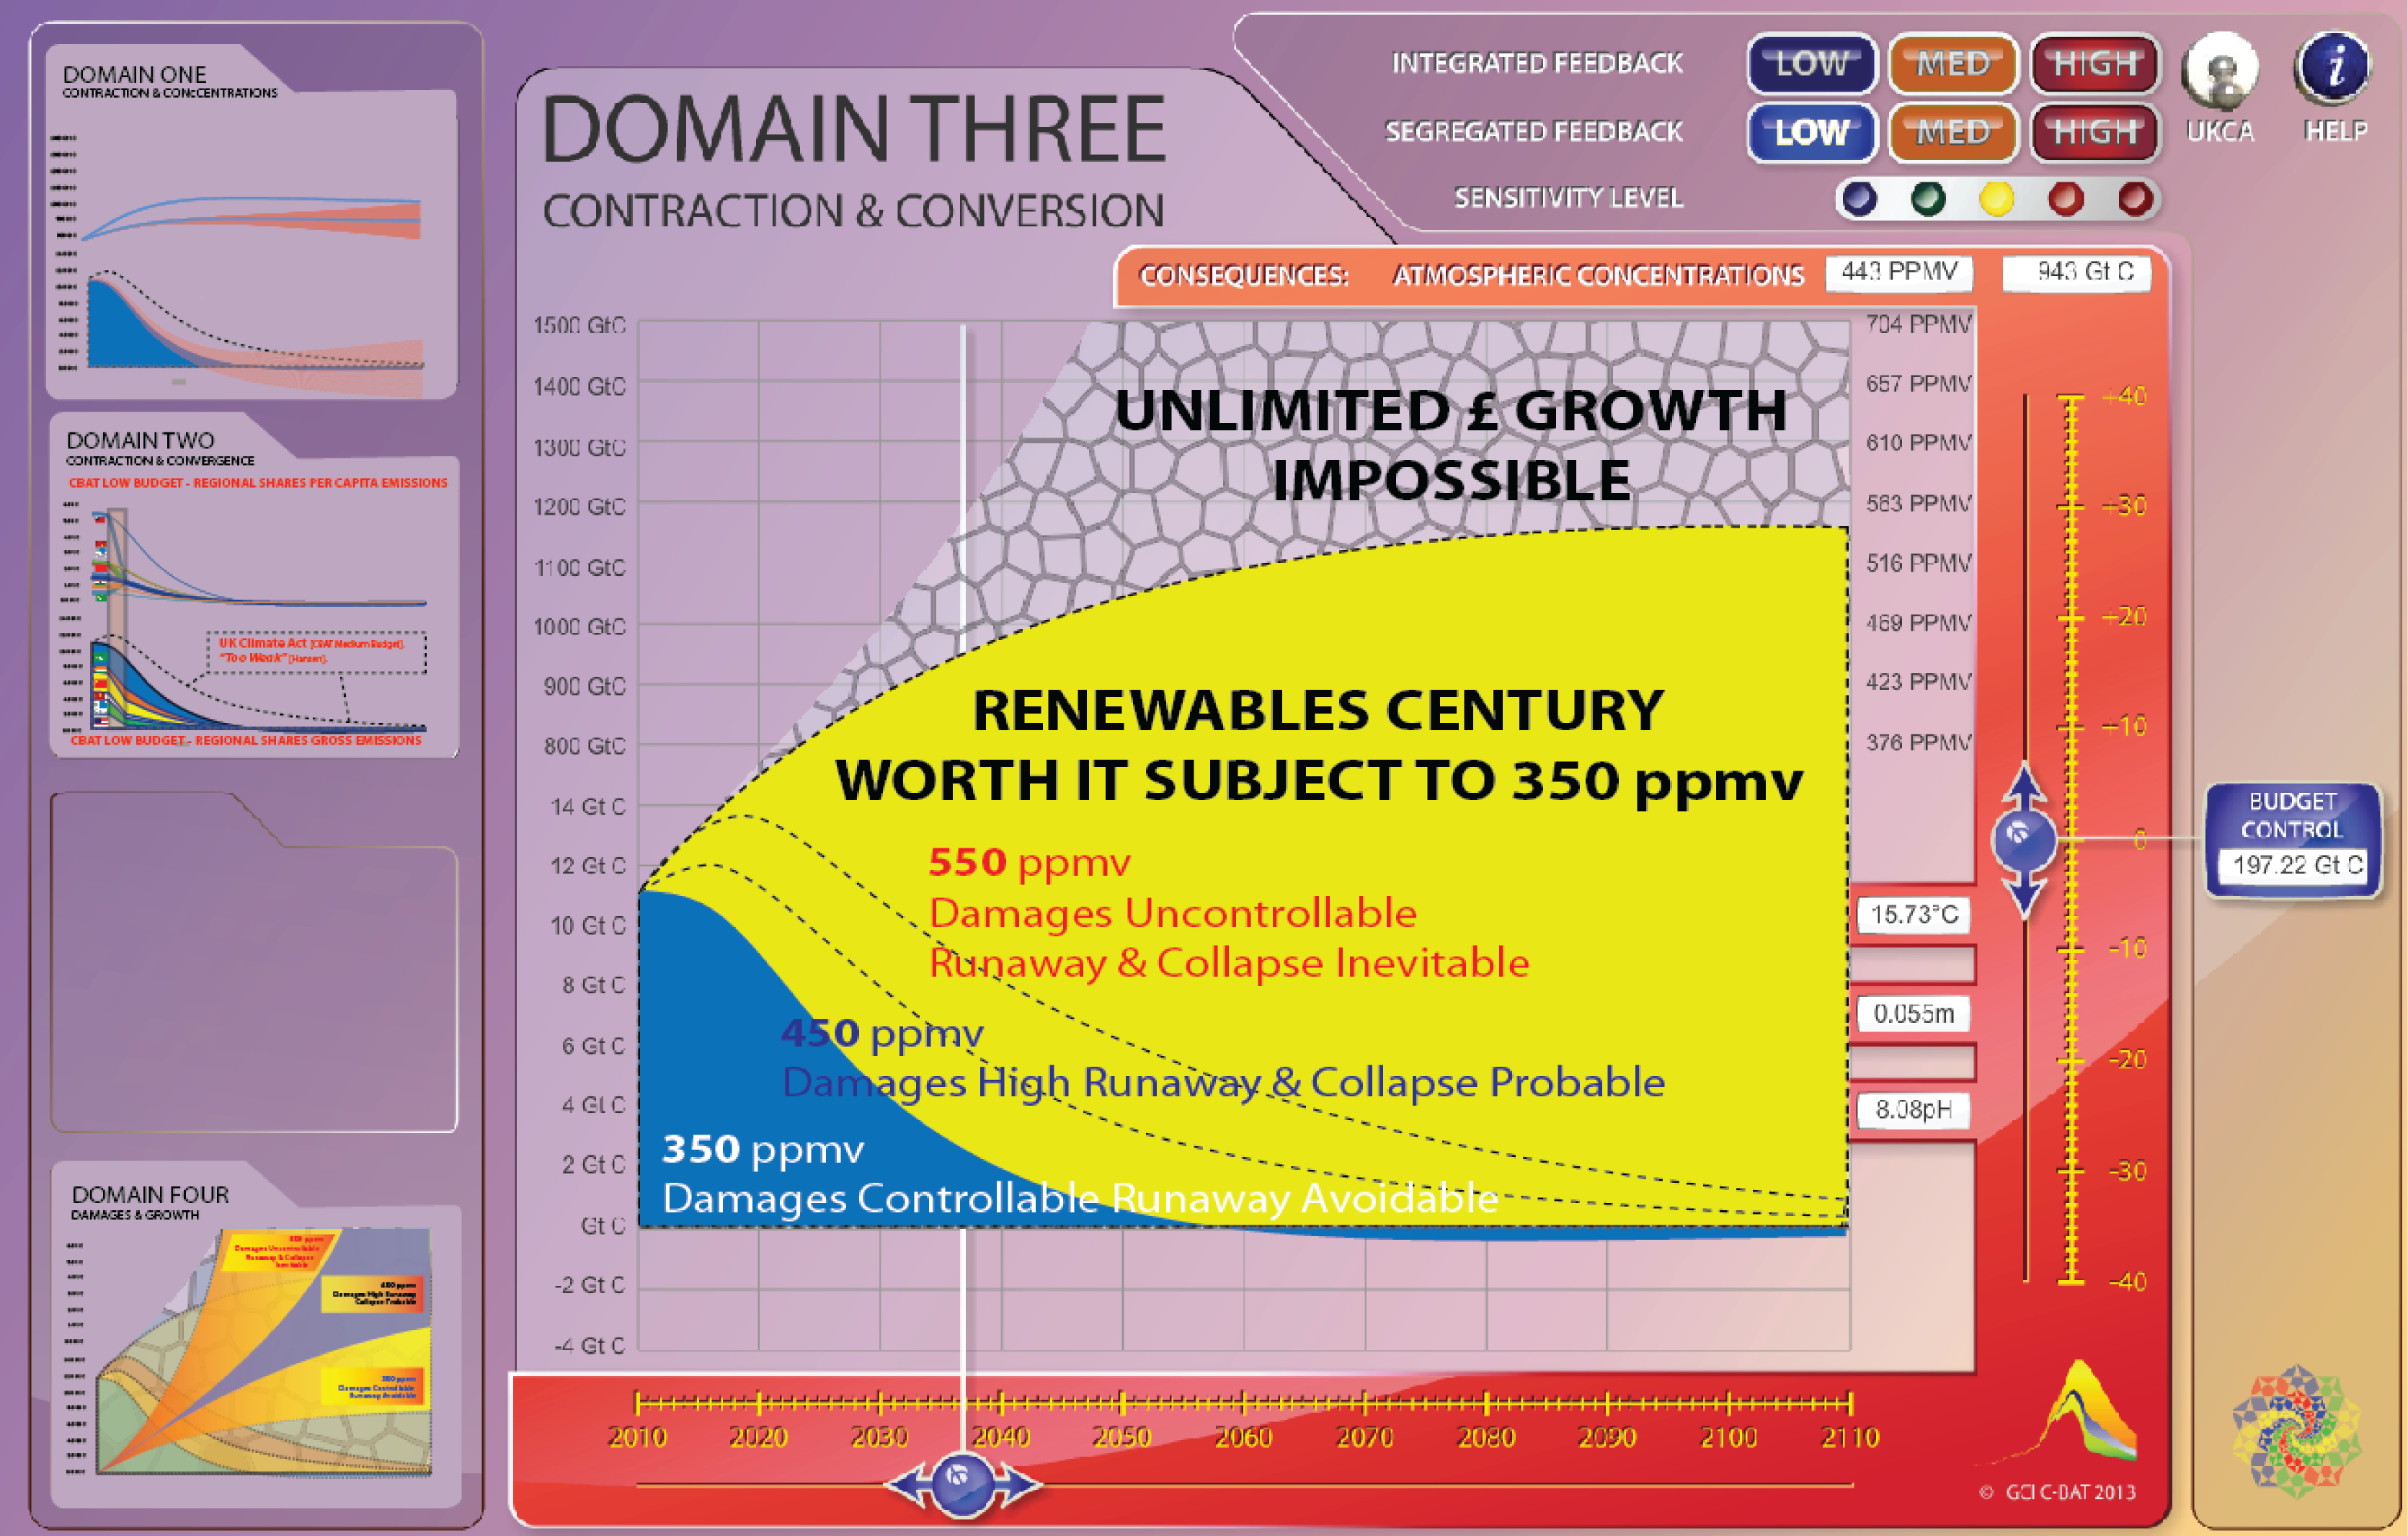
Moreover, the higher the budget chosen, the more likely it is that non-human, non-budget 'feedback-emissions/effects' will happen and become added to the 'Emission-Pathway' that emerges and the resultant 'Atmospheric Concentrations Pathway' that actually occurs as a result.
Consequently and even if this poses a formidable measurement-challenge, 'Budget-emissions' must be defined and differentiated and measured separately from 'Feedback-Emissions'.
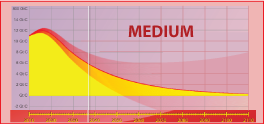
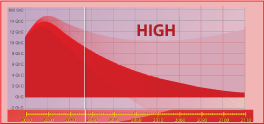
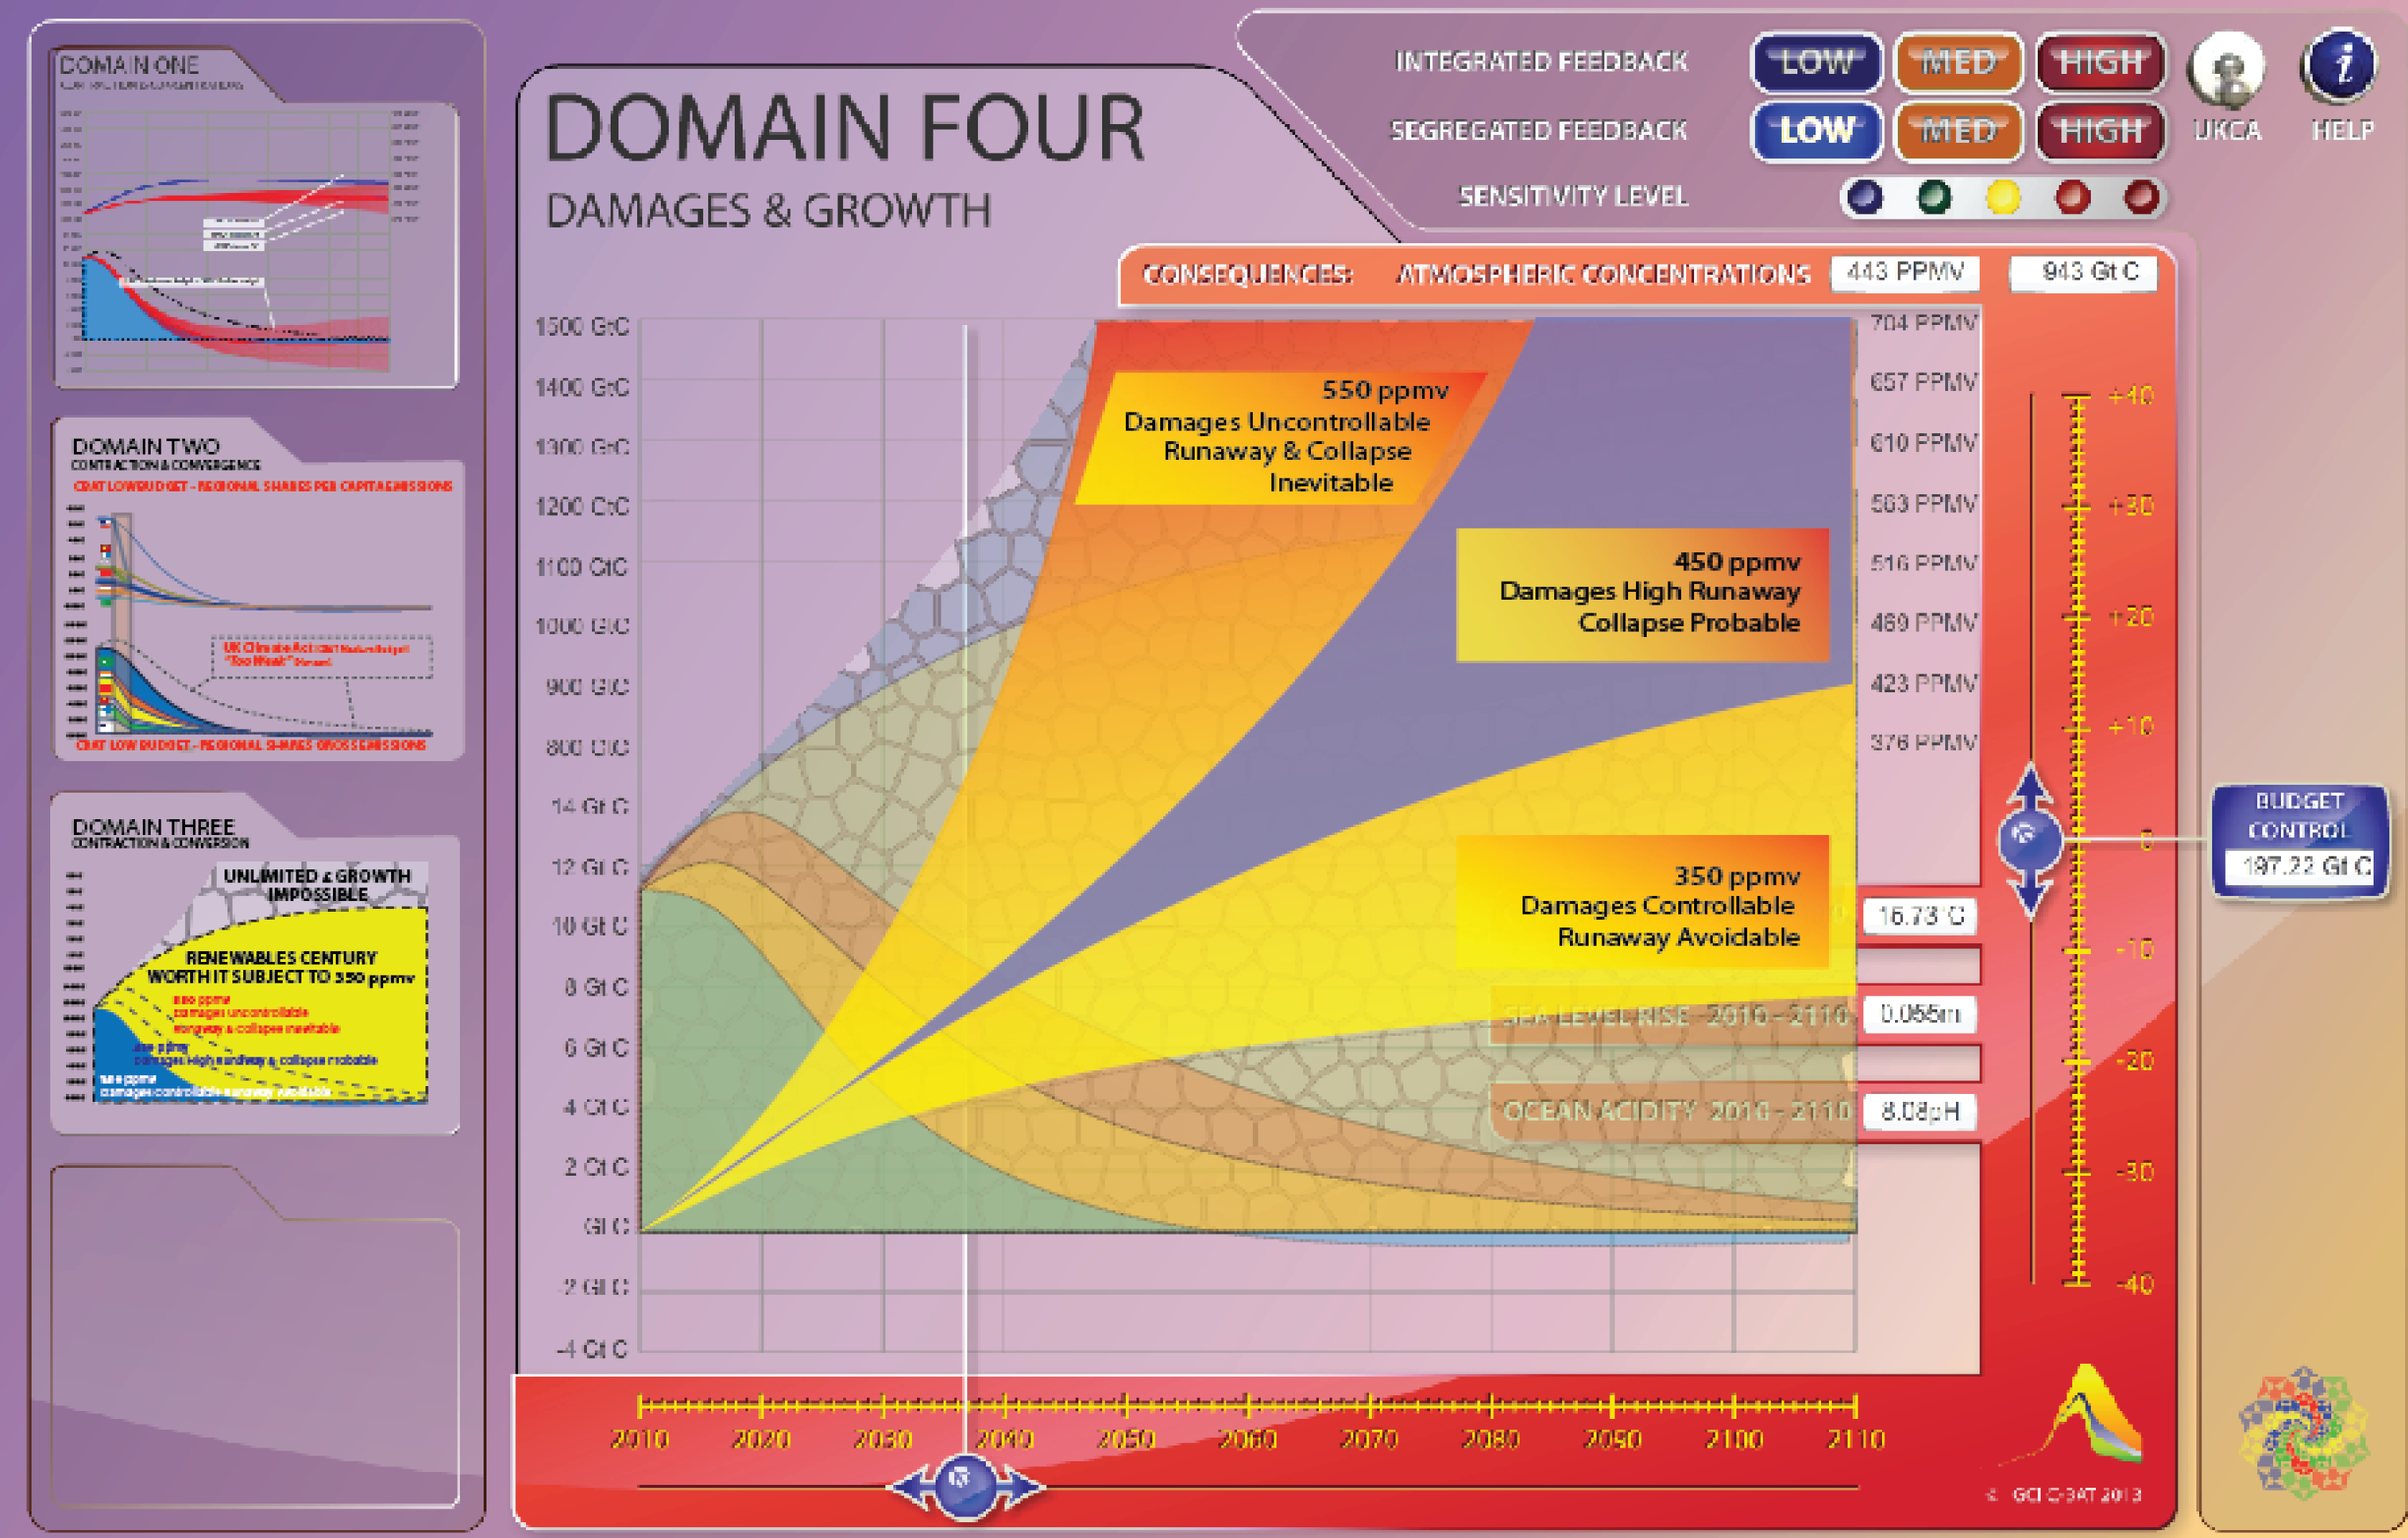
What is clear is that, whatever the rate, these feedback-emissions will start gradually and accelerate over time as the planet warms. With 'Segregated Feedback' this is what CBAT attempts to lay out in a heuristic, user-interactive way.
In this - 'Medium Basic' - CBAT instance of 'segregated feedback emissions', the assumption made behind the concentration curves [the accumulation curves] is that for each position of the vertical slider [+40 to -40] the concentration curves, an accumulation of all the feedback emissions position selected plus only half the fixed budget emissions accumulate, moving incrementally over each of the years 2010 to 2100. So by 2100 another roughly 200 Gt C has been added to the atmosphere more than the 200 Gt C added along the CAF 50% curve. In other words a total that starts at CAF 50% in 2010 and ends at CAF100% by 2110.
Comparison of any CBAT user-choices made with the Contraction:Concentration paths in the UK Climate Act is instantly possible with this use of the UKCA On/Off Toggle Switch.