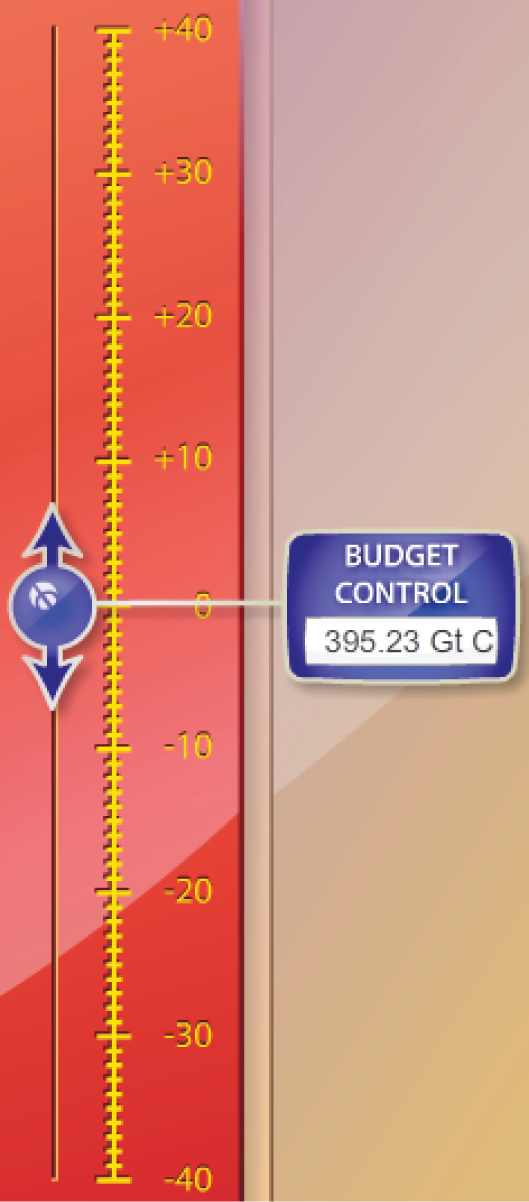
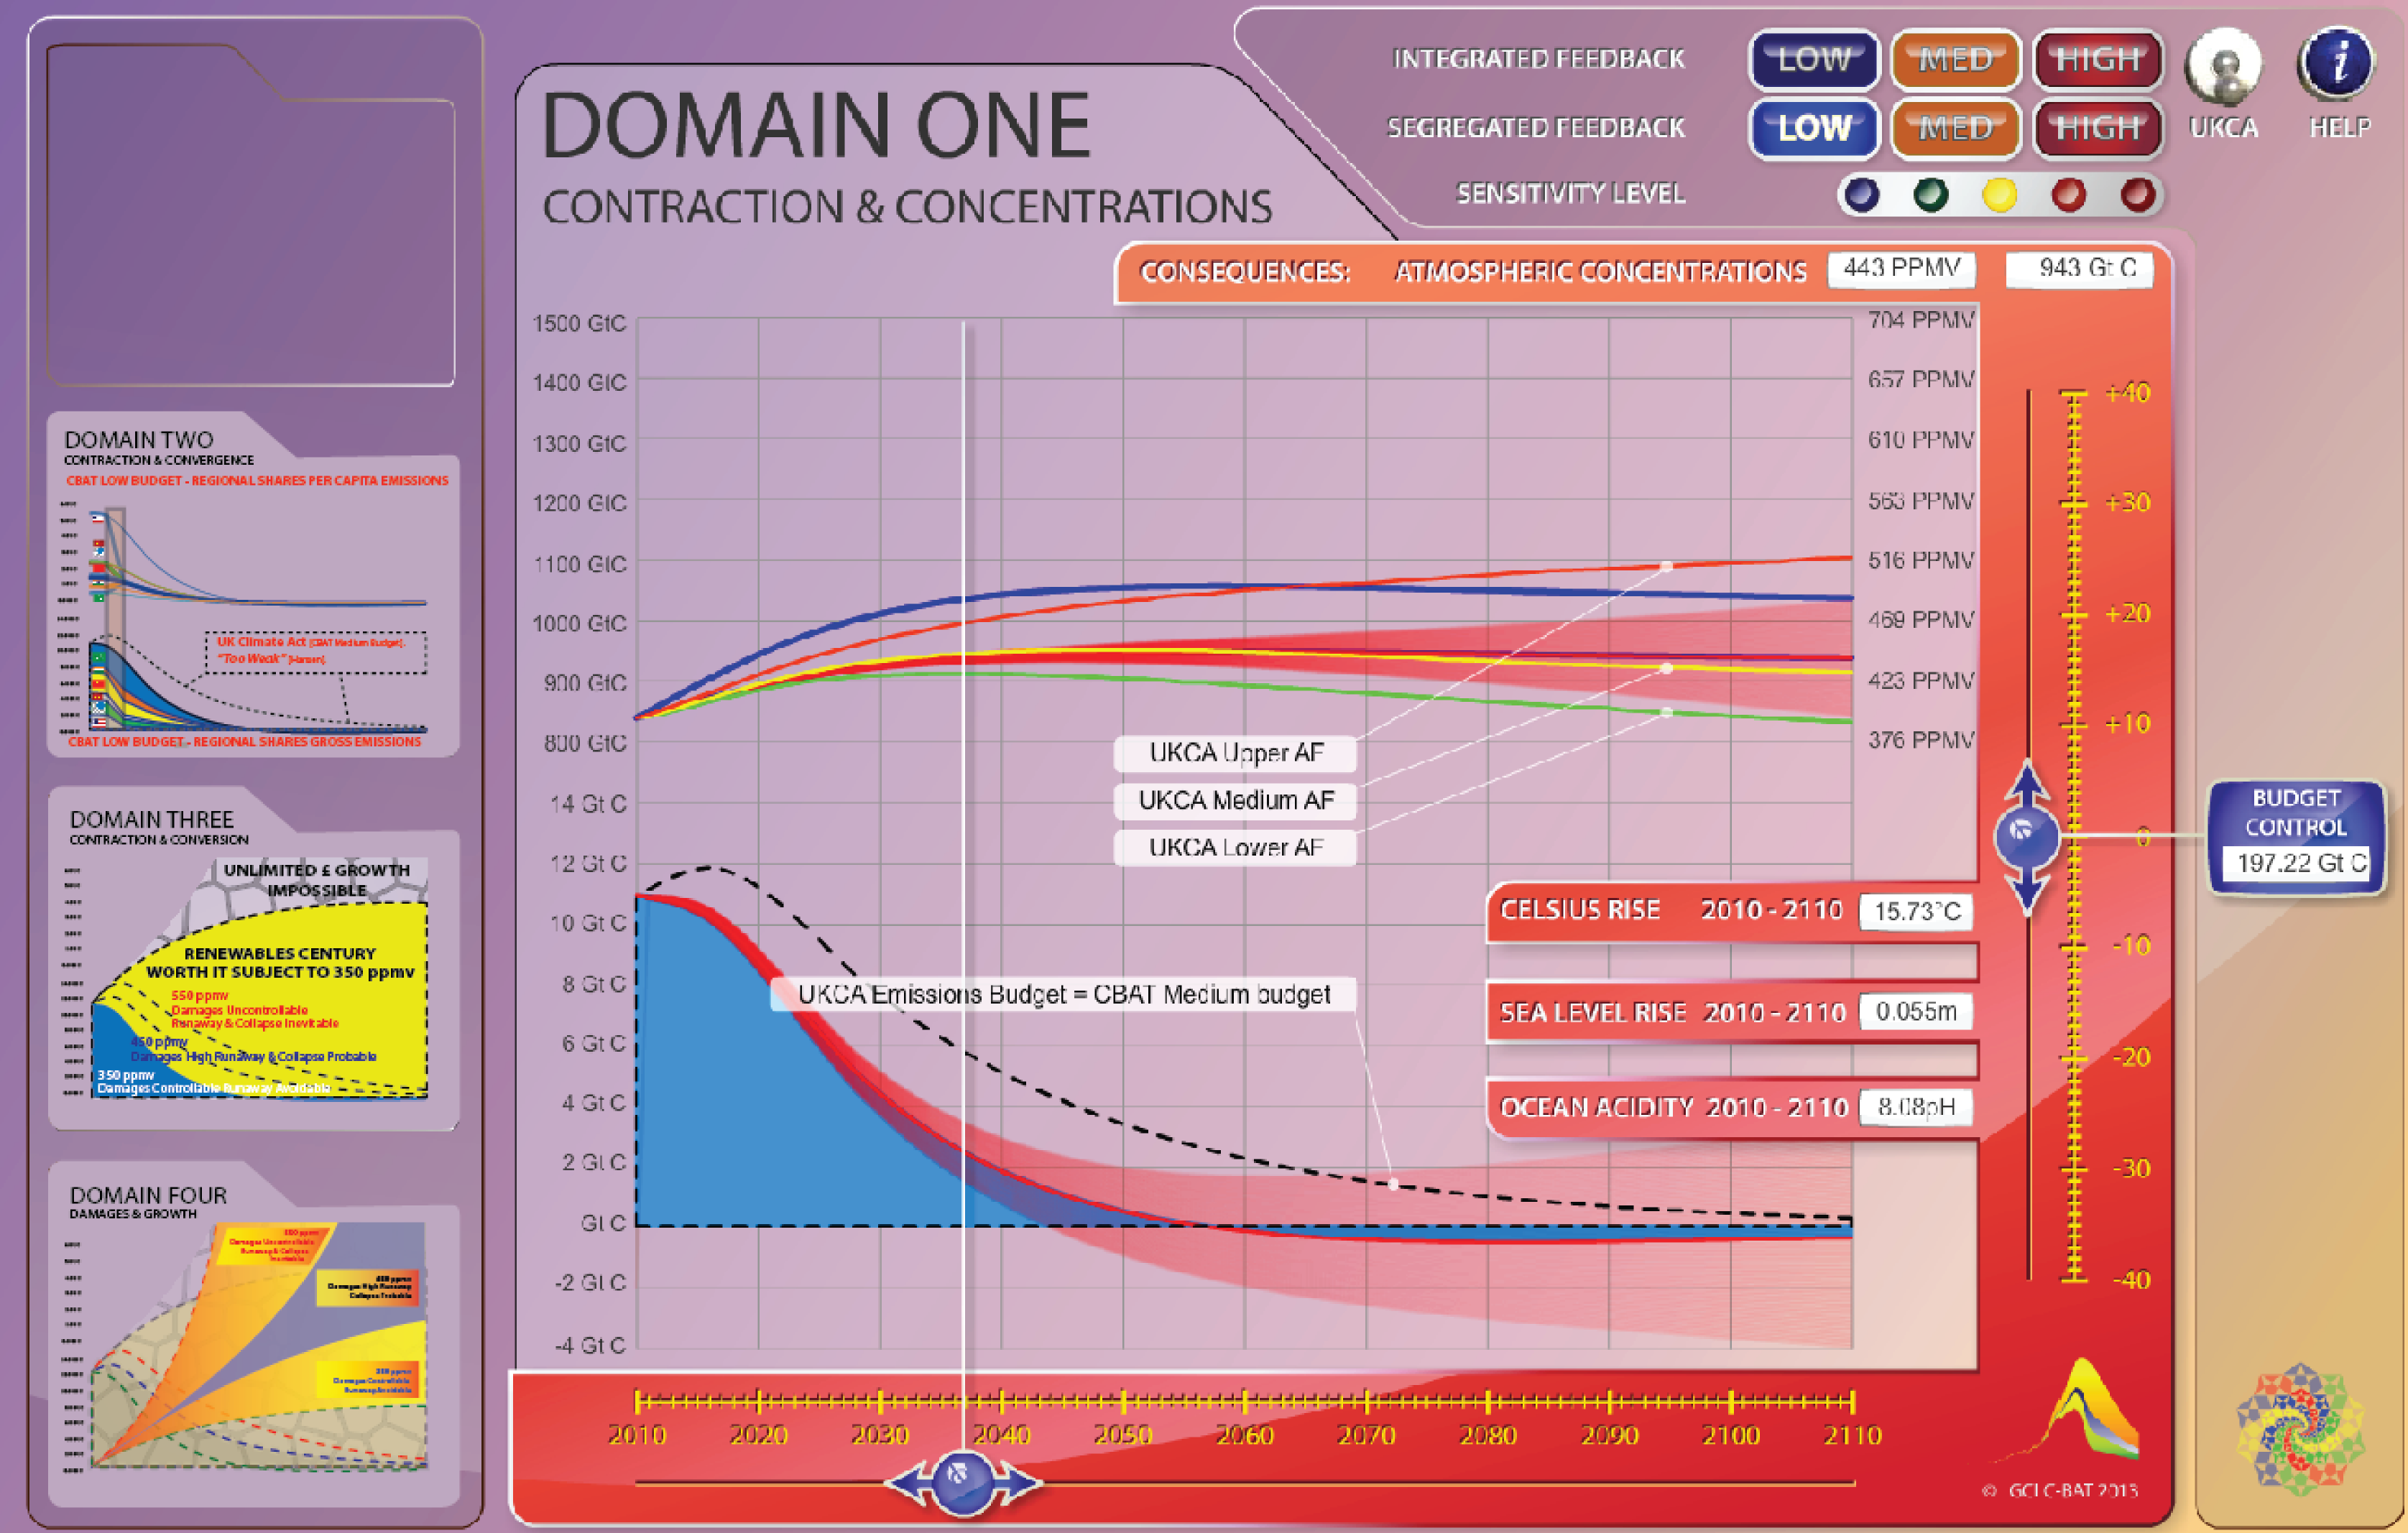
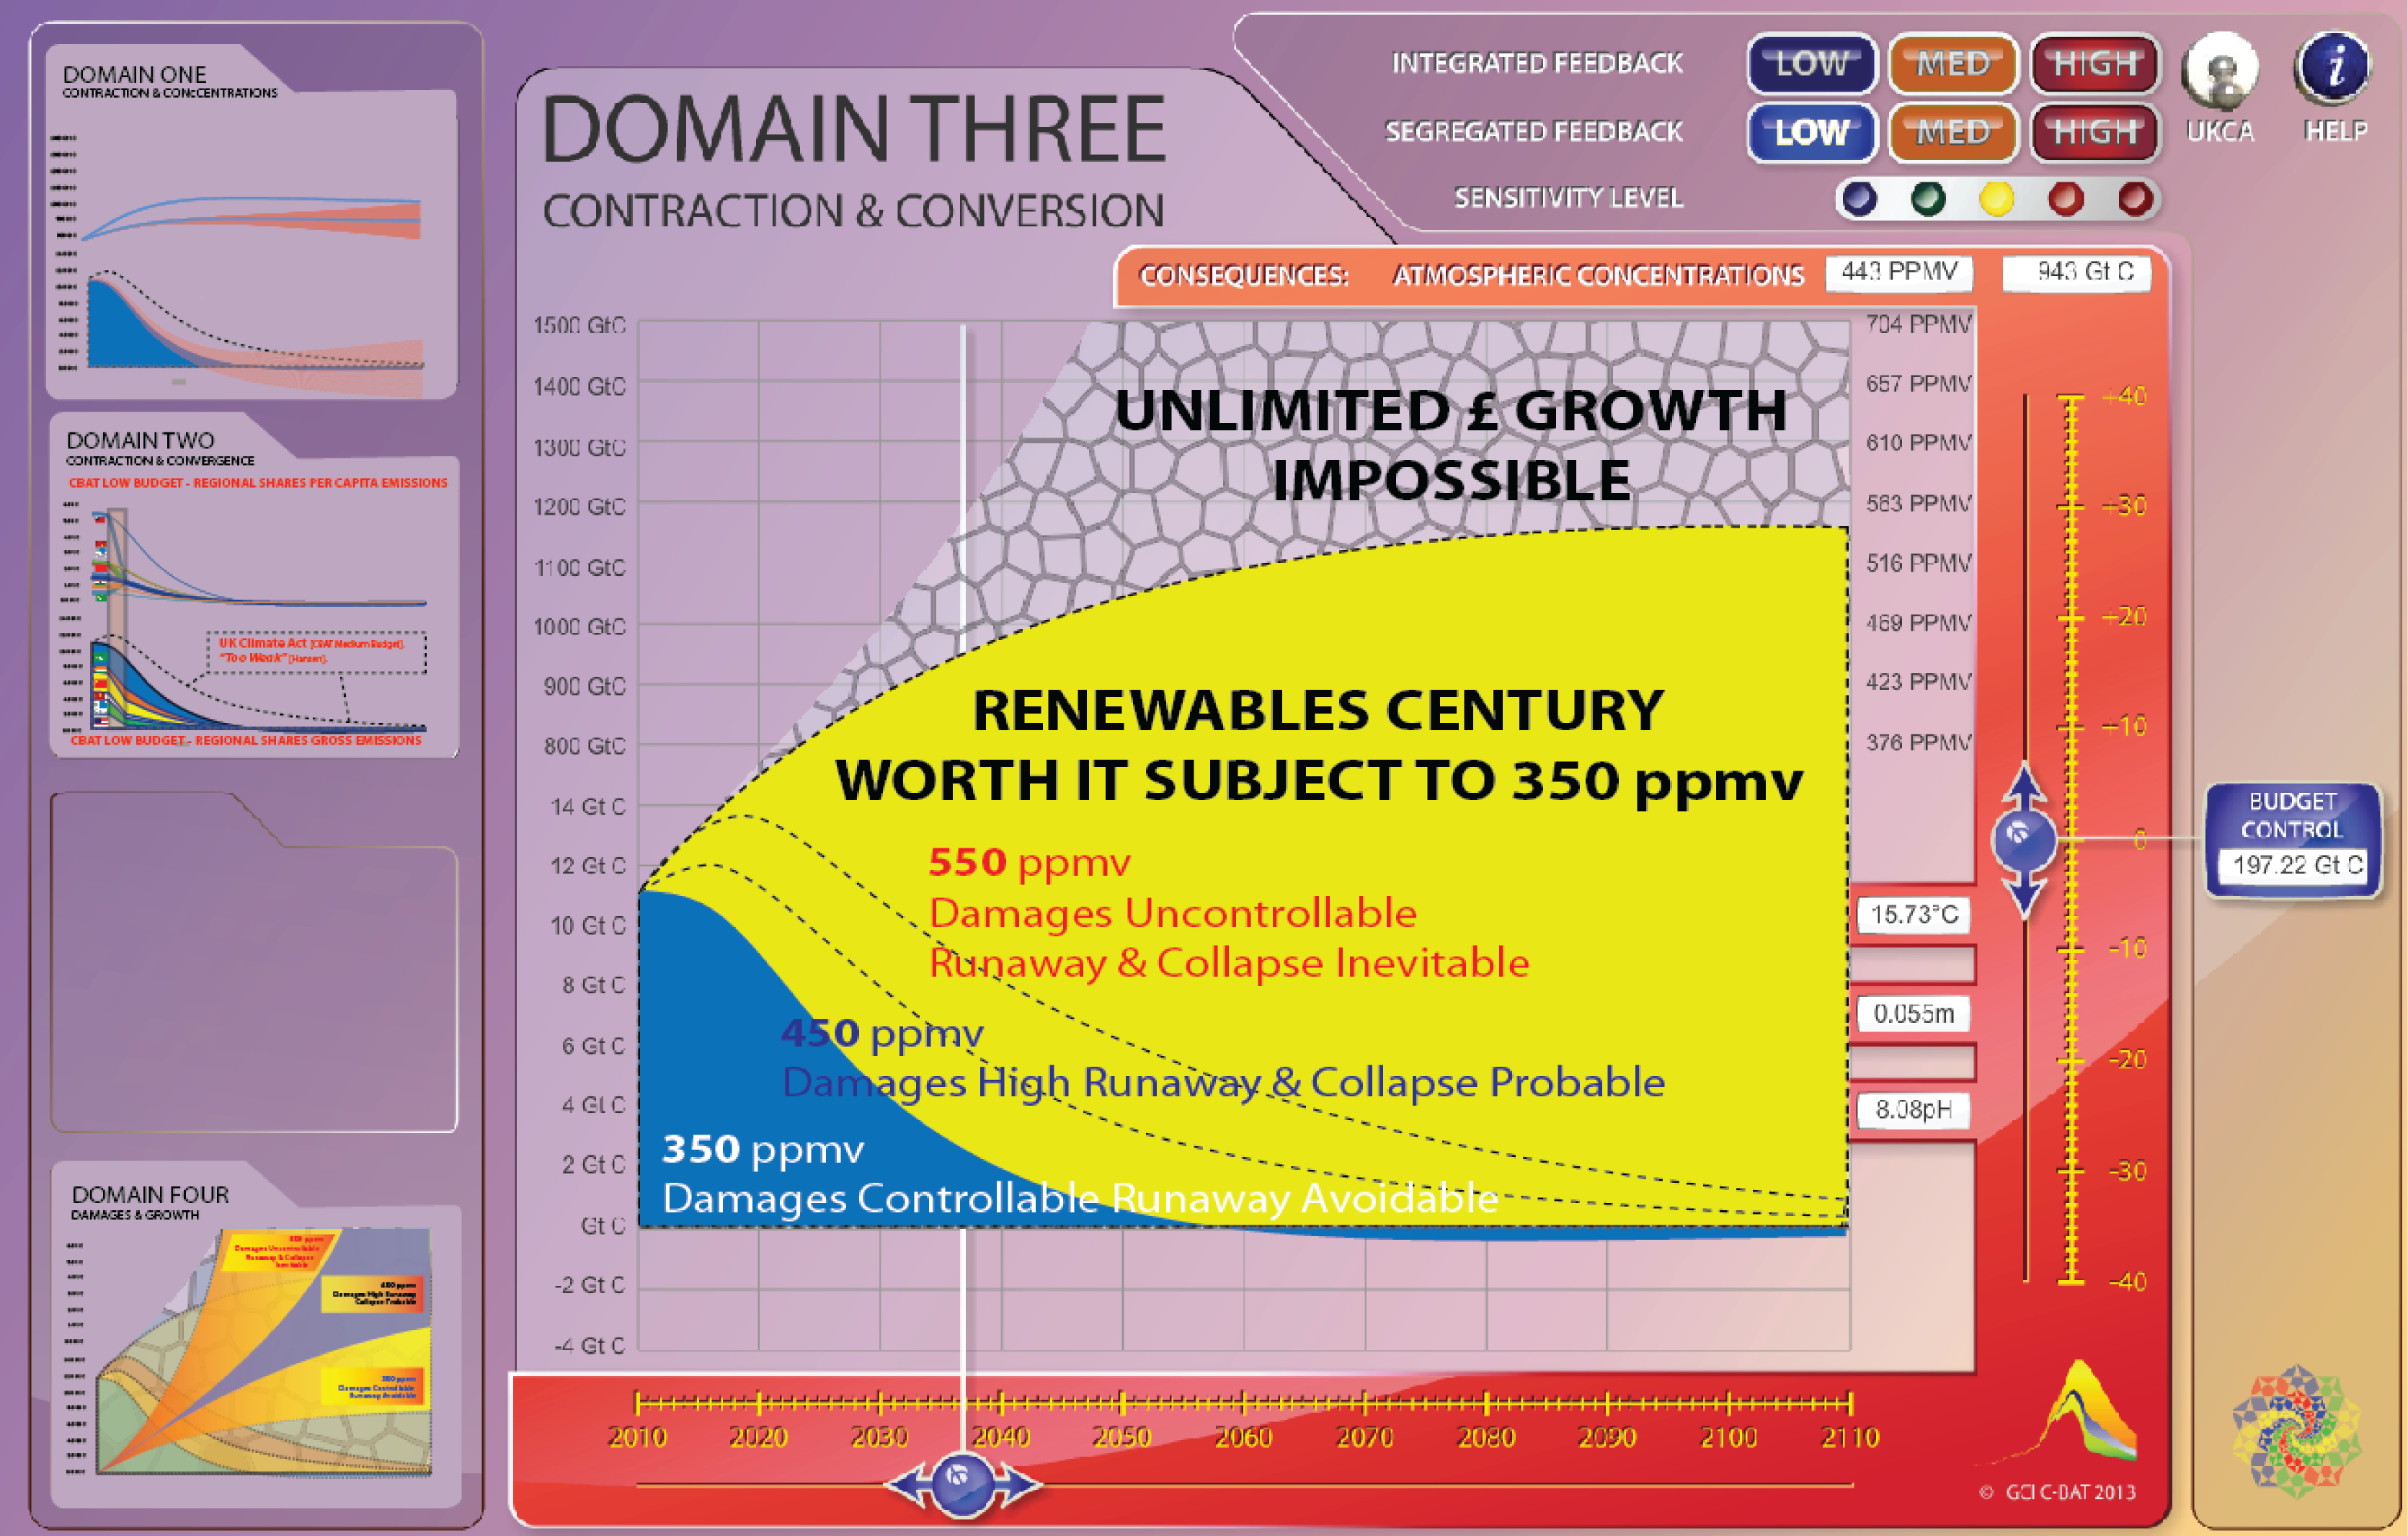
For all budgets in CBAT, this right-hand side vertical axis shows ‘user-choice' 'slider-positions’ from ‘plus-40’ through ‘0’ to ‘minus-40’.
As emissions go from the 'zero' position to the highest position [+40], 50% of the extra carbon-weight [2010-2110] per increment of each budget-step is added to the concentrations level which are rising by position to +40 where it equals the CAF-100% reference path by 2110.
Similarly, as emissions go from the 'zero' position to the lowest position [-40], 505 of reduced carbon-weight [2010-2110] per increment of each budget-step is subtracted from the concentrations level are falling by position to -40 where it equal CAF-0% reference by 2110.
Overall this is an 'indicative array' where users are invited to take a position and see the results. The rate of this additions/subtractions is an approximation of the rate at which the carbon-weight is added-to/subtracted-from the atmosphere in the UKCA according to the rate in the 'Integrated-Feedback'-concentration array ['Upper, Medium, Lower'] in the UKCA [see UKCA Toggle-Switch].
This integral of carbon-weight addition/subraction to the carbon-budget, in this 'Integrated Feedback' approach is time-distributed to maintain as nearly as possible, the shape of the UKCA carbon budget.
The lowest position [-40], follows the same procedure but is equal to the concentrations level falling to equal the starting position in 2010 or effectivly a CAF-0% reference by 2110. In short with both the Integrated and the Segregated Feedback options, when concentrations reach: -
the highest position [+40], it is equal to the concentrations level rising to equal the CAF-100% reference by 2110, [positive feedback] and
the middle position [0], it is equal to the concentrations level rising constantly to equal the CAF-50% reference by 2110, and
the lowest position [-40], it is equal to the concentrations level falling to equal the starting position in 2010 or effectivly a CAF-0% reference by 2110 [negative feedback].
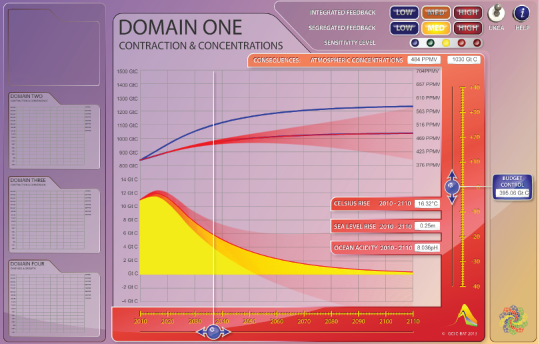
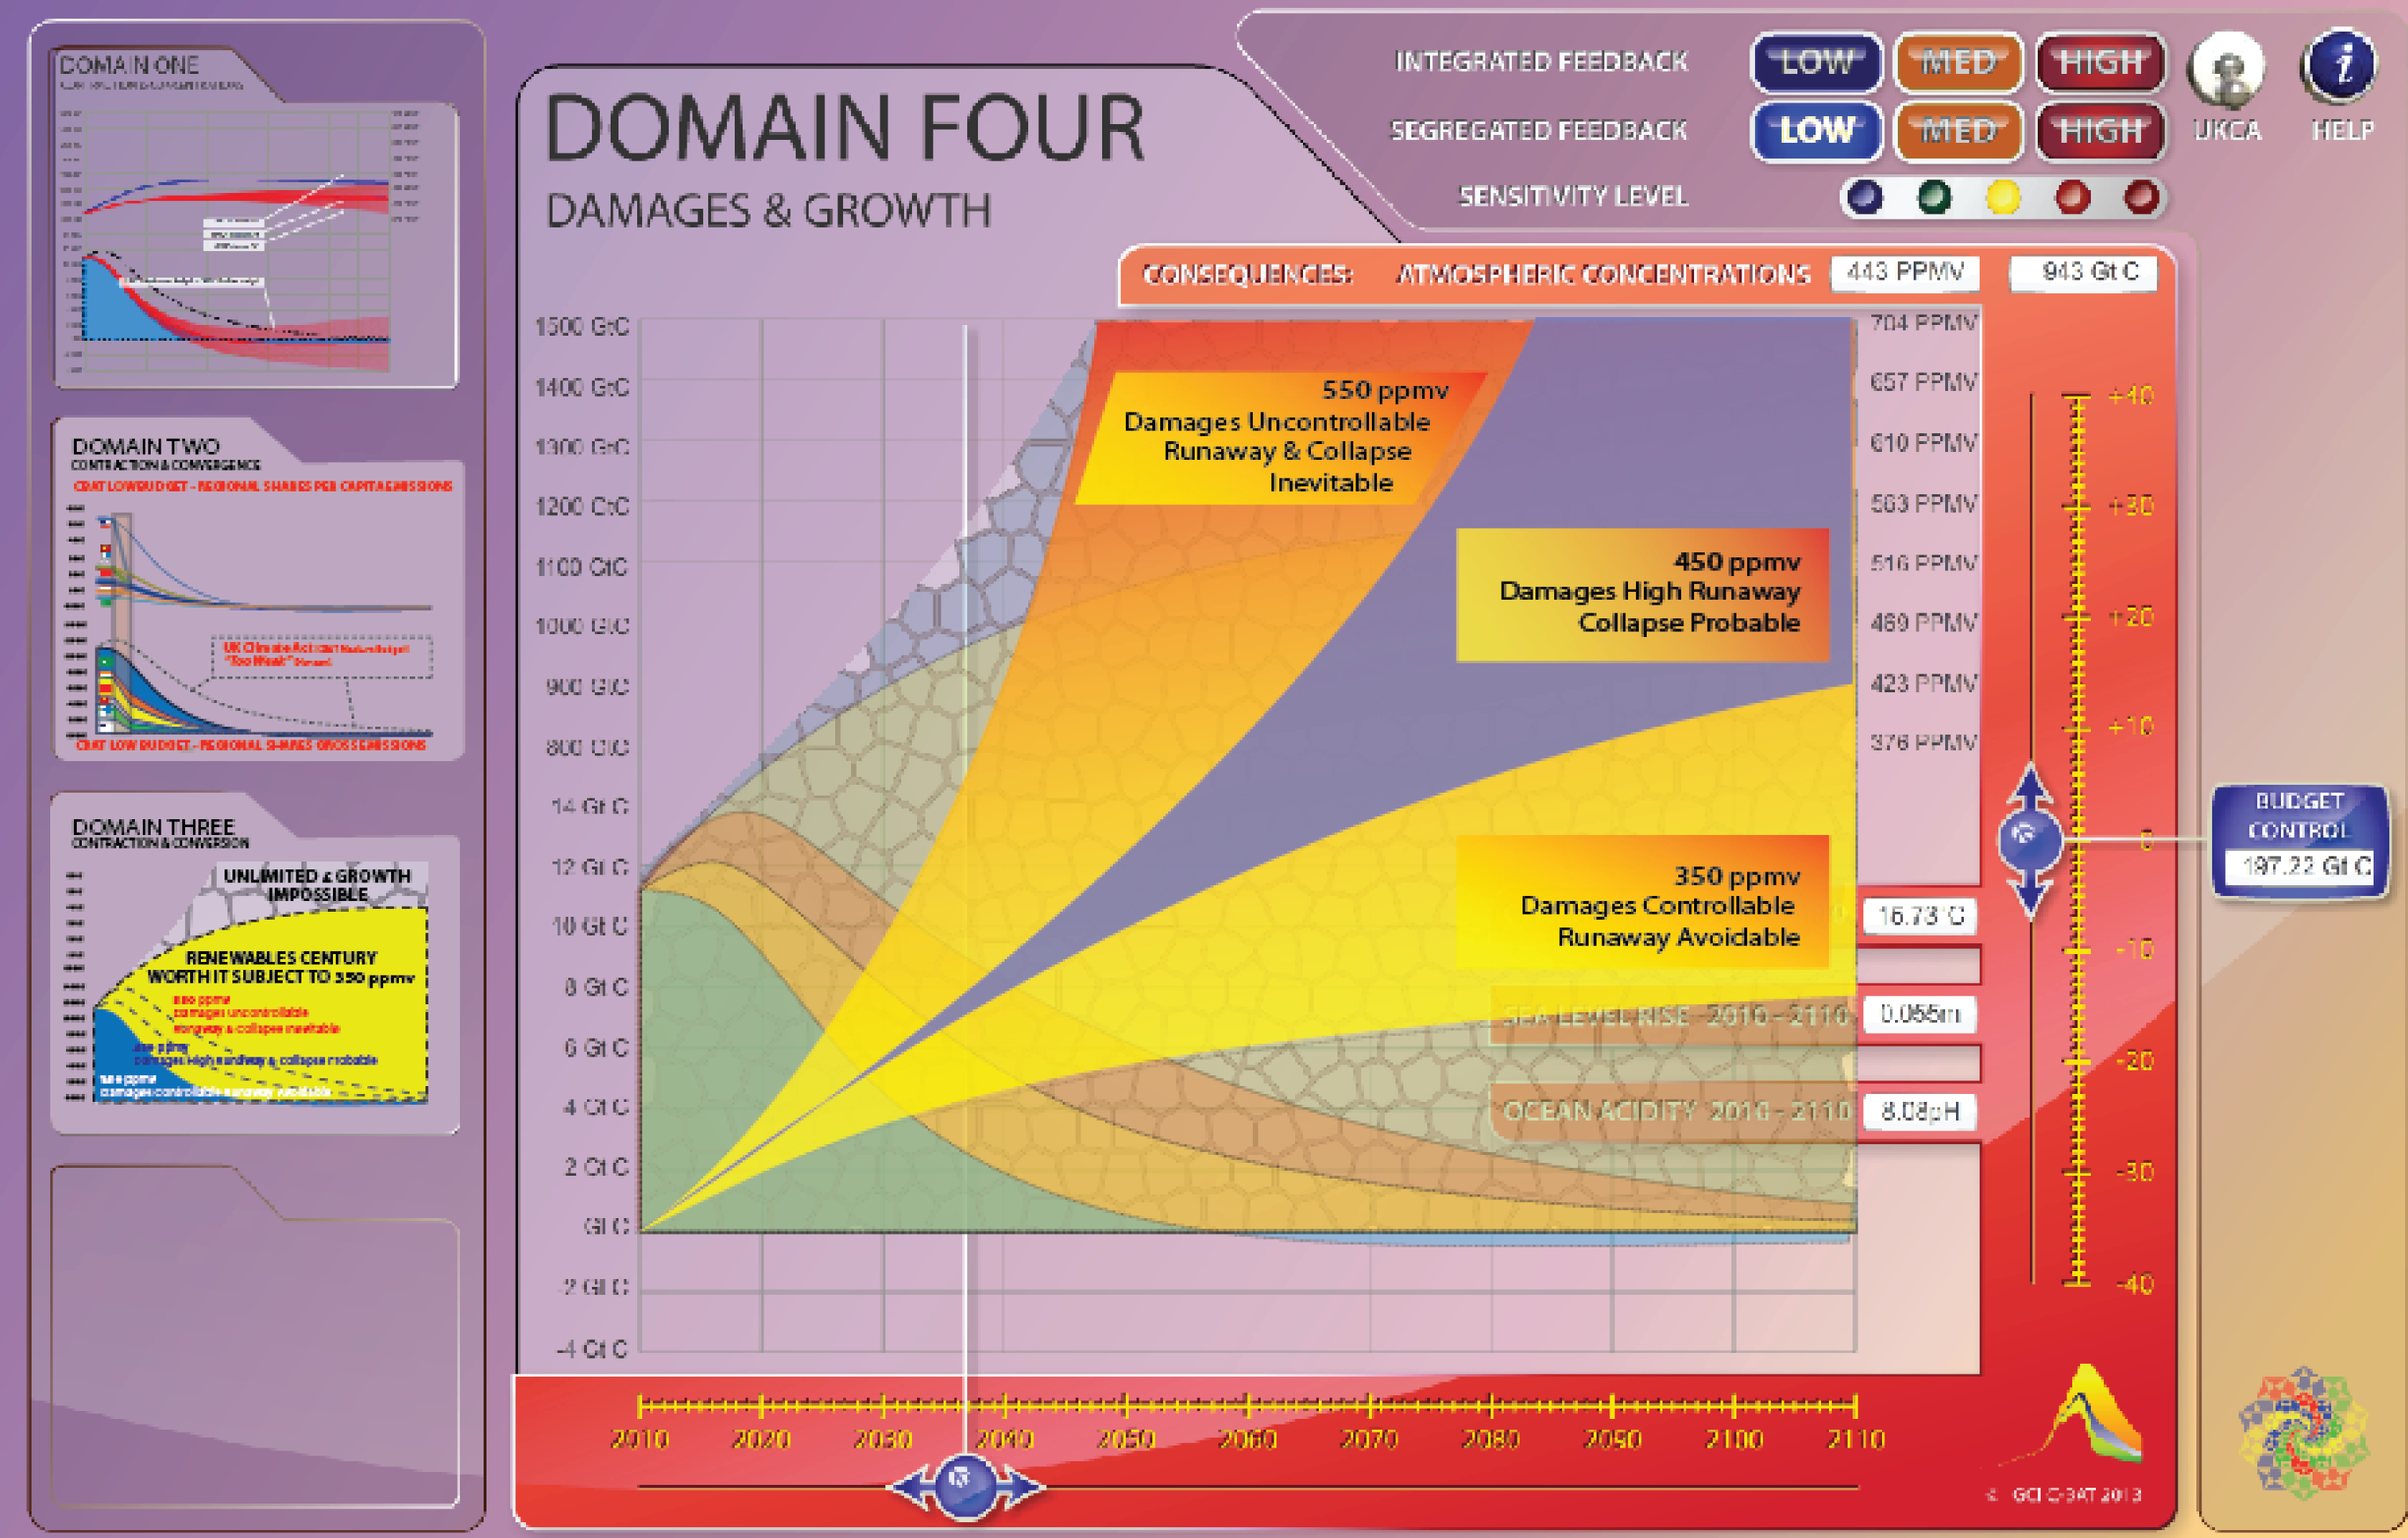
However, the key difference between 'Integrated-Feedback' [as with UKMO] and 'Segregated-Feedback' [as laid out in CBAT ] is the deceleration-curves versus the acceleration-curves - in other words the shape of the emissions and concentrations curves generated.
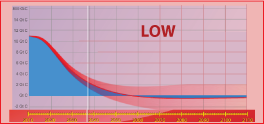
Simply put, deceleration curves imply the problem is under control while acceleration curves imply the problem is increasingly not under control.
It is the reality of the latter - acceleration curves consequent on the positive feedback effects, which the UKMO left out of the climate-model behind the UK Climate Act - which is why GCI feels the likelihood of 'negative-feedback' which they portray with their 'Median Case' where concentrations fall crom 2050 onwards, is at best 'theoretical'.
Add these effects and the much greater likelihood of 'positive-feedback' where concentrations will not fall but continue to rise, is really the defining issue. This is why pursuing global-climate-policy-development based on the precautionary principle - around the CBAT LOW Budget - should be our greatest concern.