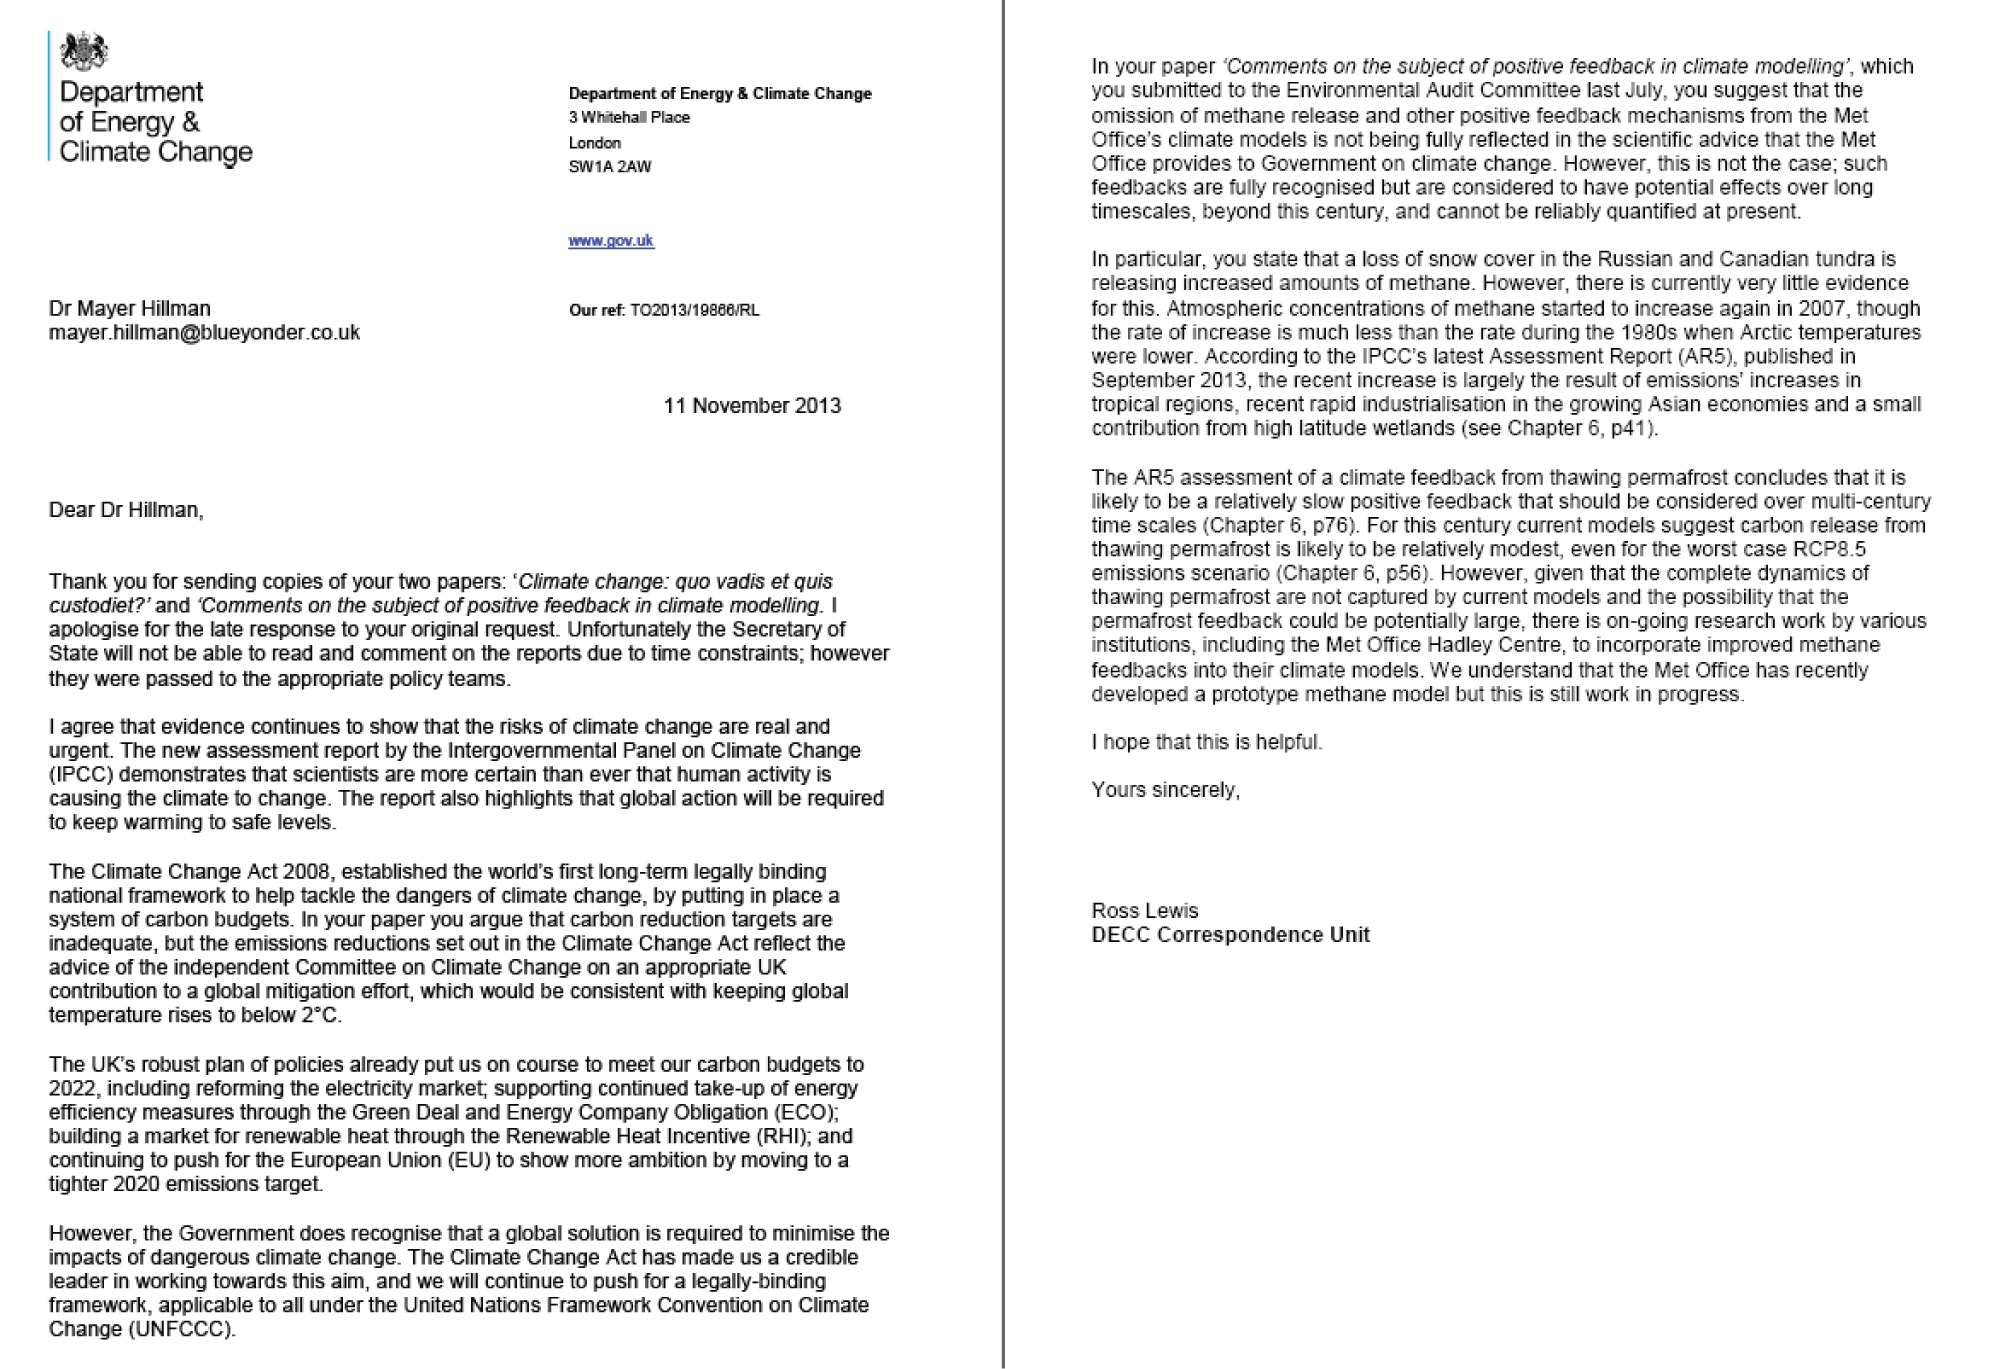
DECC Civil Servants project obvious and serious inaccuracies in this letter to Mayer Hillman [11 11 2013].
To take just one example. The letter states: -
"The AR5 assessment of a climate feedback from thawing permafrost concludes that it is likely to be a relatively slow positive feedback that should be considered over multi-century time scales. For this century current models suggest carbon release from thawing permafrost is likely to be relatively modest, even for the worst case RCP 8.5 emissions scenario.
However, given that the complete dynamics of thawing permafrost are not captured by current models and the possibility that the permafrost feedback could be potentially large, there is on-going research work by various institutions, including the Met Office Hadley Centre, to incorporate improved methane feedbacks into their climate models. We understand that the Met Office has recently developed a prototype methane model but this is still work in progress."
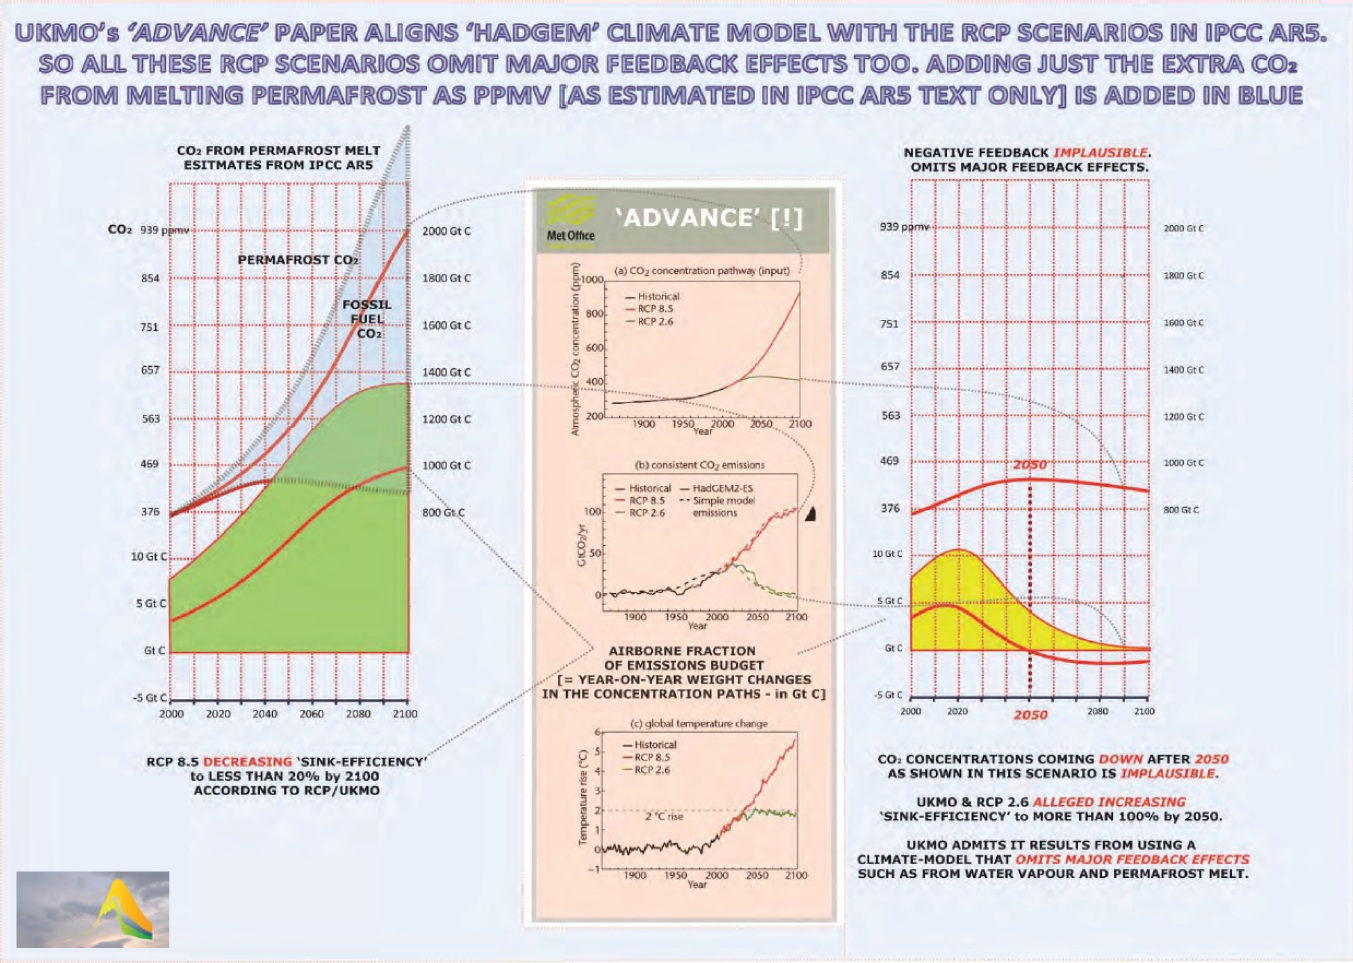
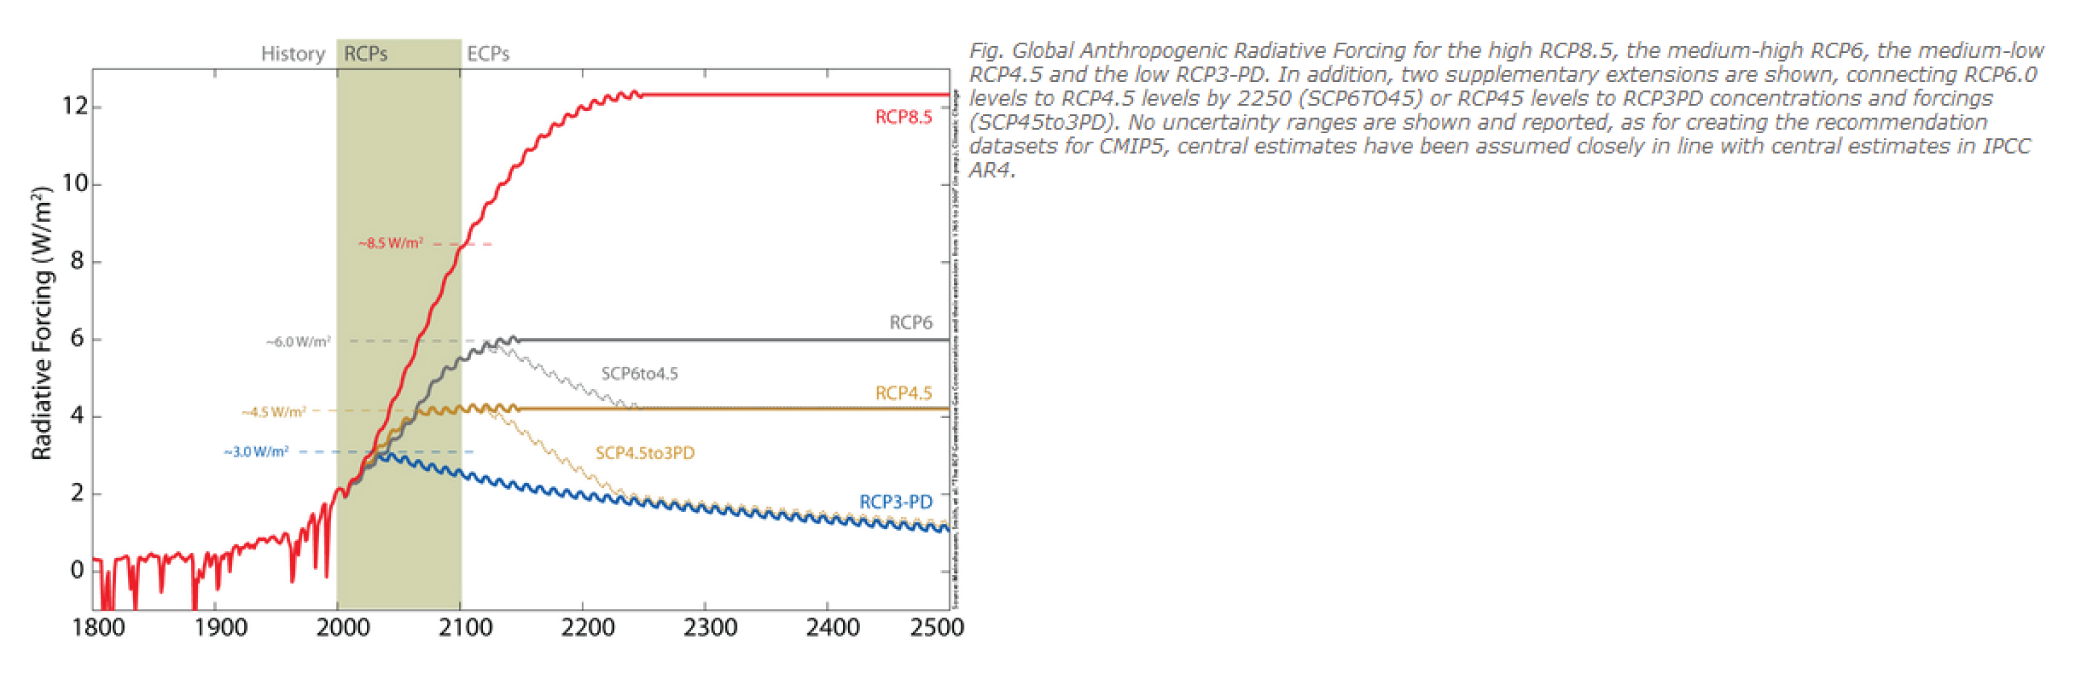
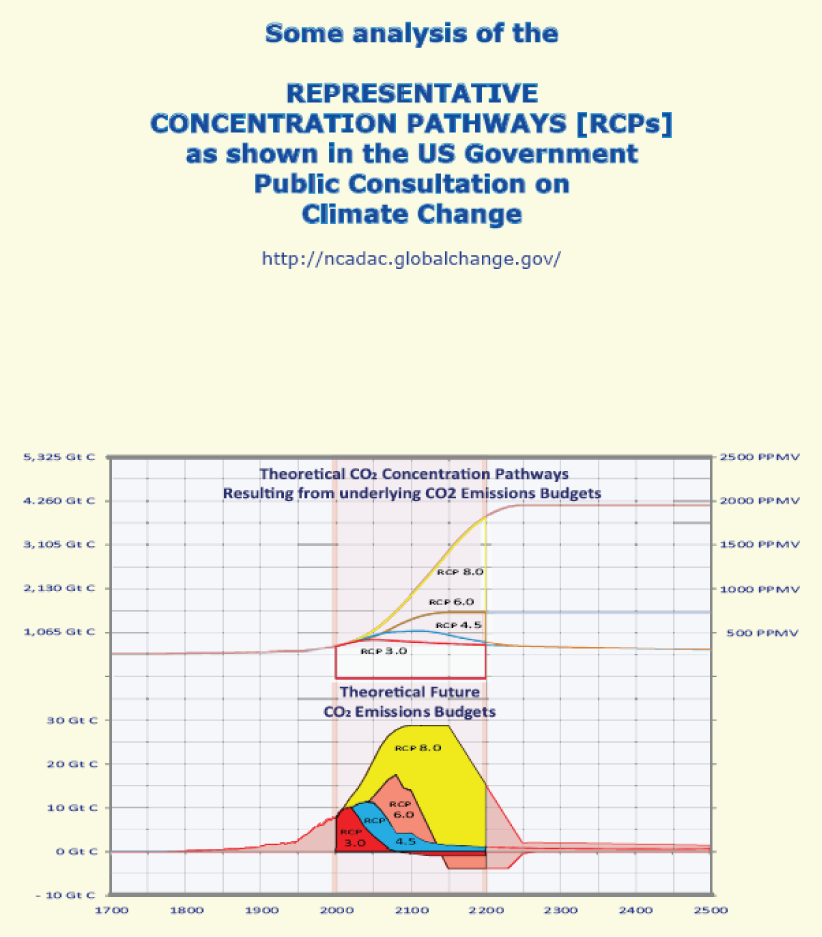
Here is RCP 8.5, as coordinated between RCP and UKMO in 2010 and now as projected in IPCC AR5.
It is important to note that these are the figures from the RCP scenarios; they are not GCI figures: -
NOTE - contrary to what DECC asserts in its letter, this is all in *this* Century [2000 -2100], where RCP 8.5 shows: -
CO2 emissions rising to 30 Gt C annually by 2100
CO2 concentrations rising to 940 ppmv by 2100 and still rising thereafter, and
IPCC's estimate of another ~100 ppmv [blue shaded area] on top of that from just 'CO2' [i.e. no CH4] from melting permafrost
temperature riseing to 6 degrees above pre-industrial by 2100.
This is hardly DECC's 'relatively modest' addition. Moreover, with RCP 8.5 temperature continues to rise until 2250 by when it [theoretically] has stablised at around 12 degrees above pre-industrial level.
Here is the relevant graphic from PIK RCP data, showing W/meter squared . . .
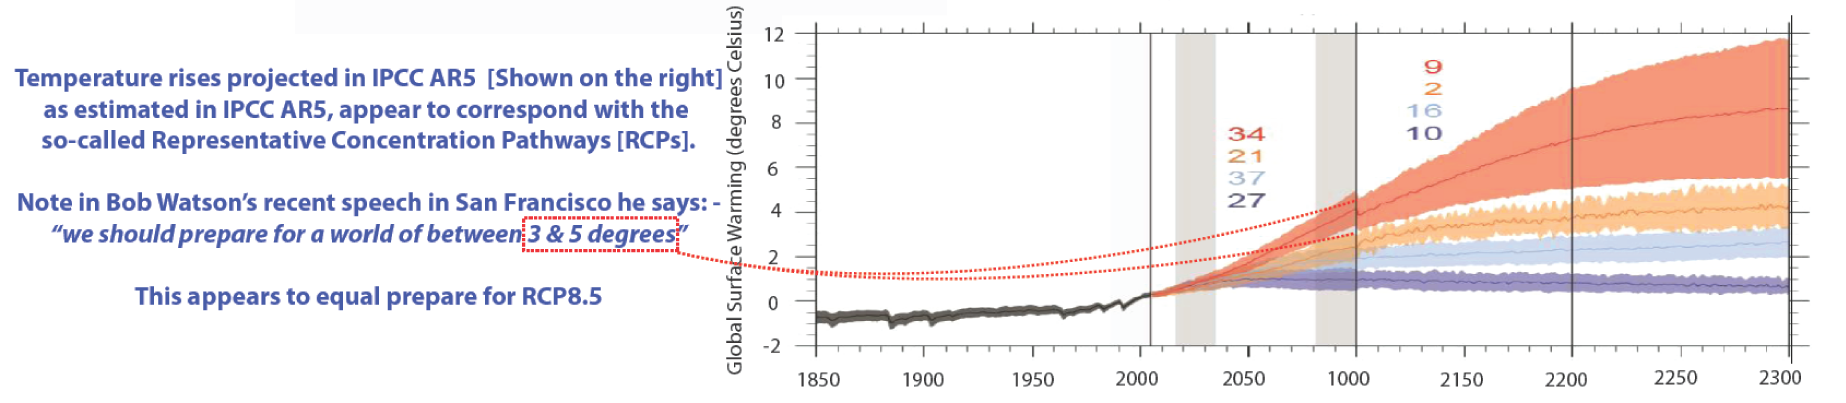
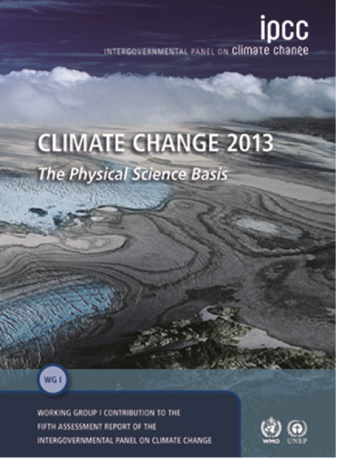
Here is the relevant graphic from IPCC AR5 draft showing temperature rising to 12 degrees by 2300 . . .
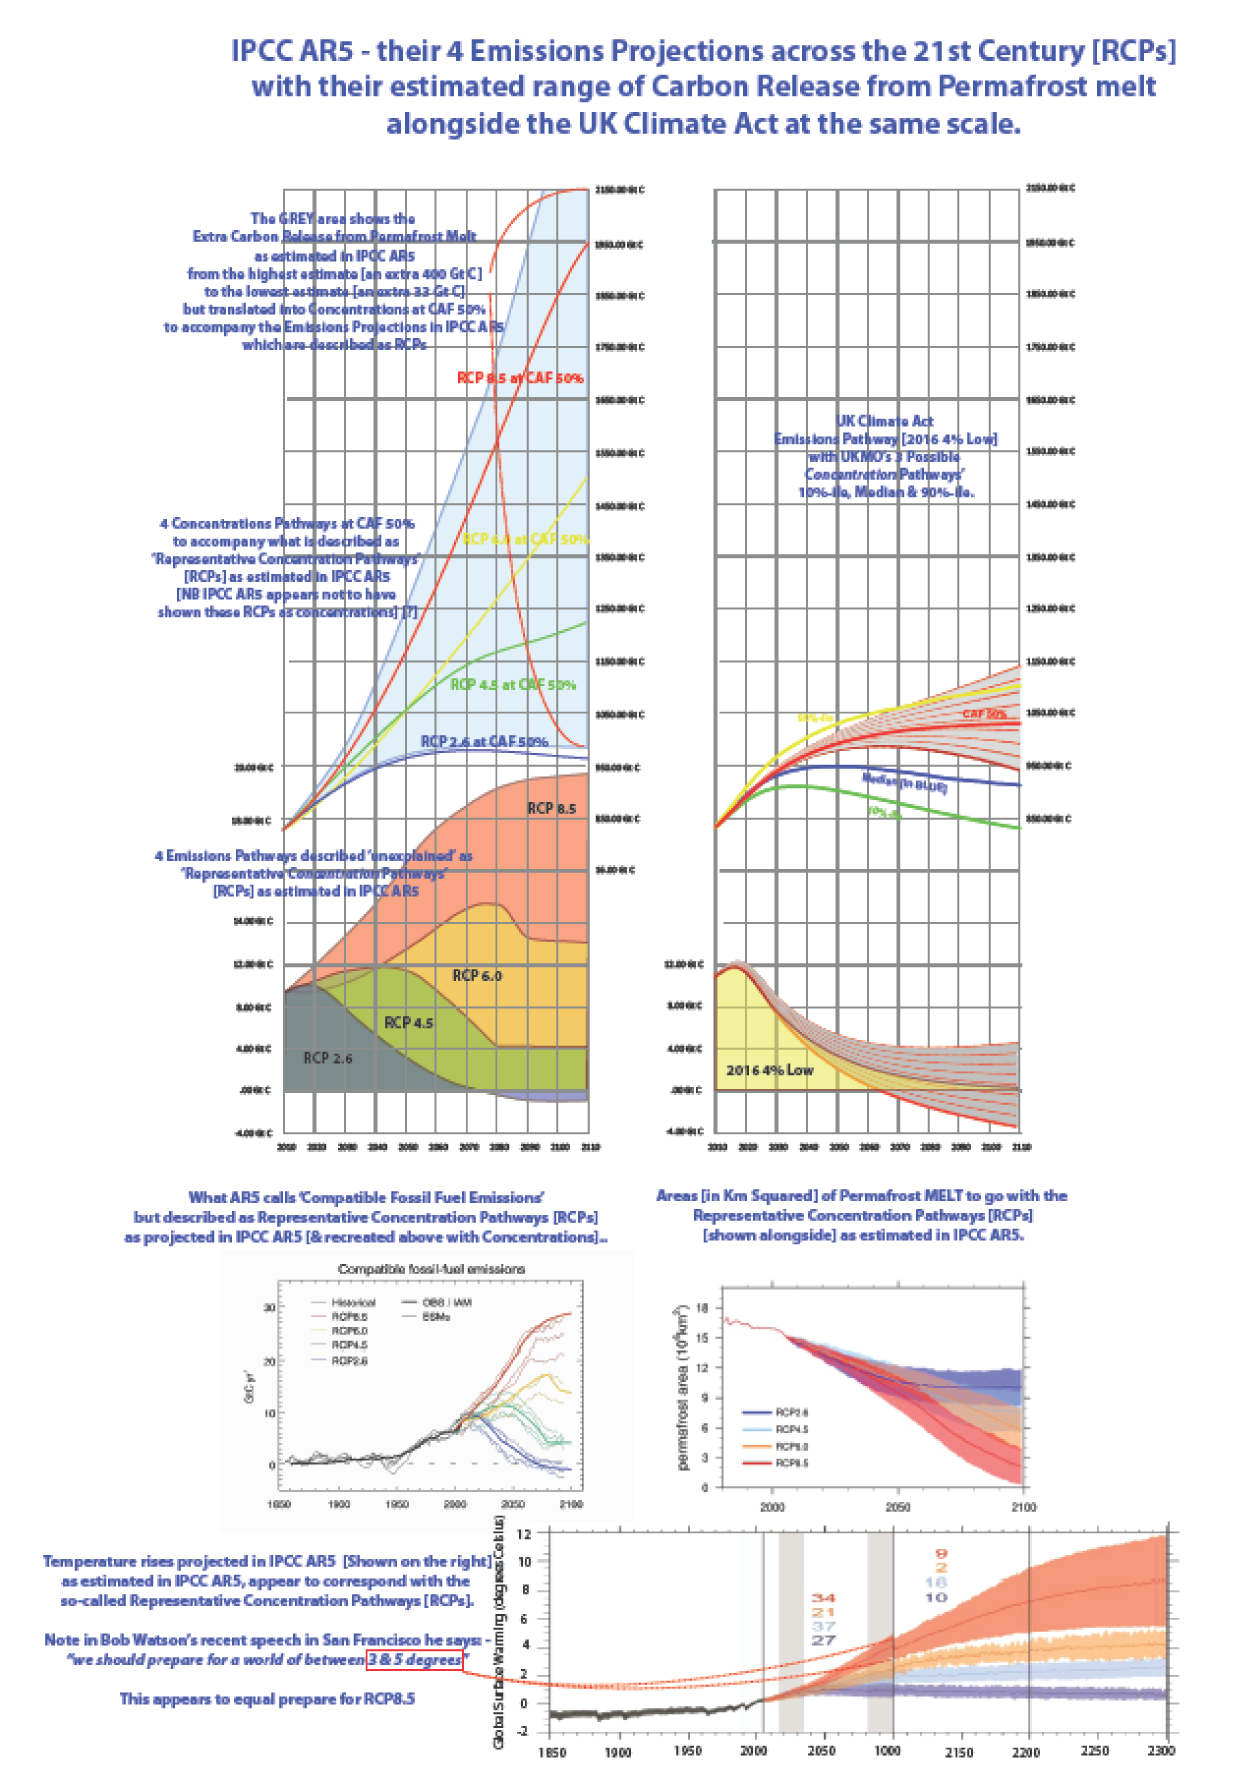
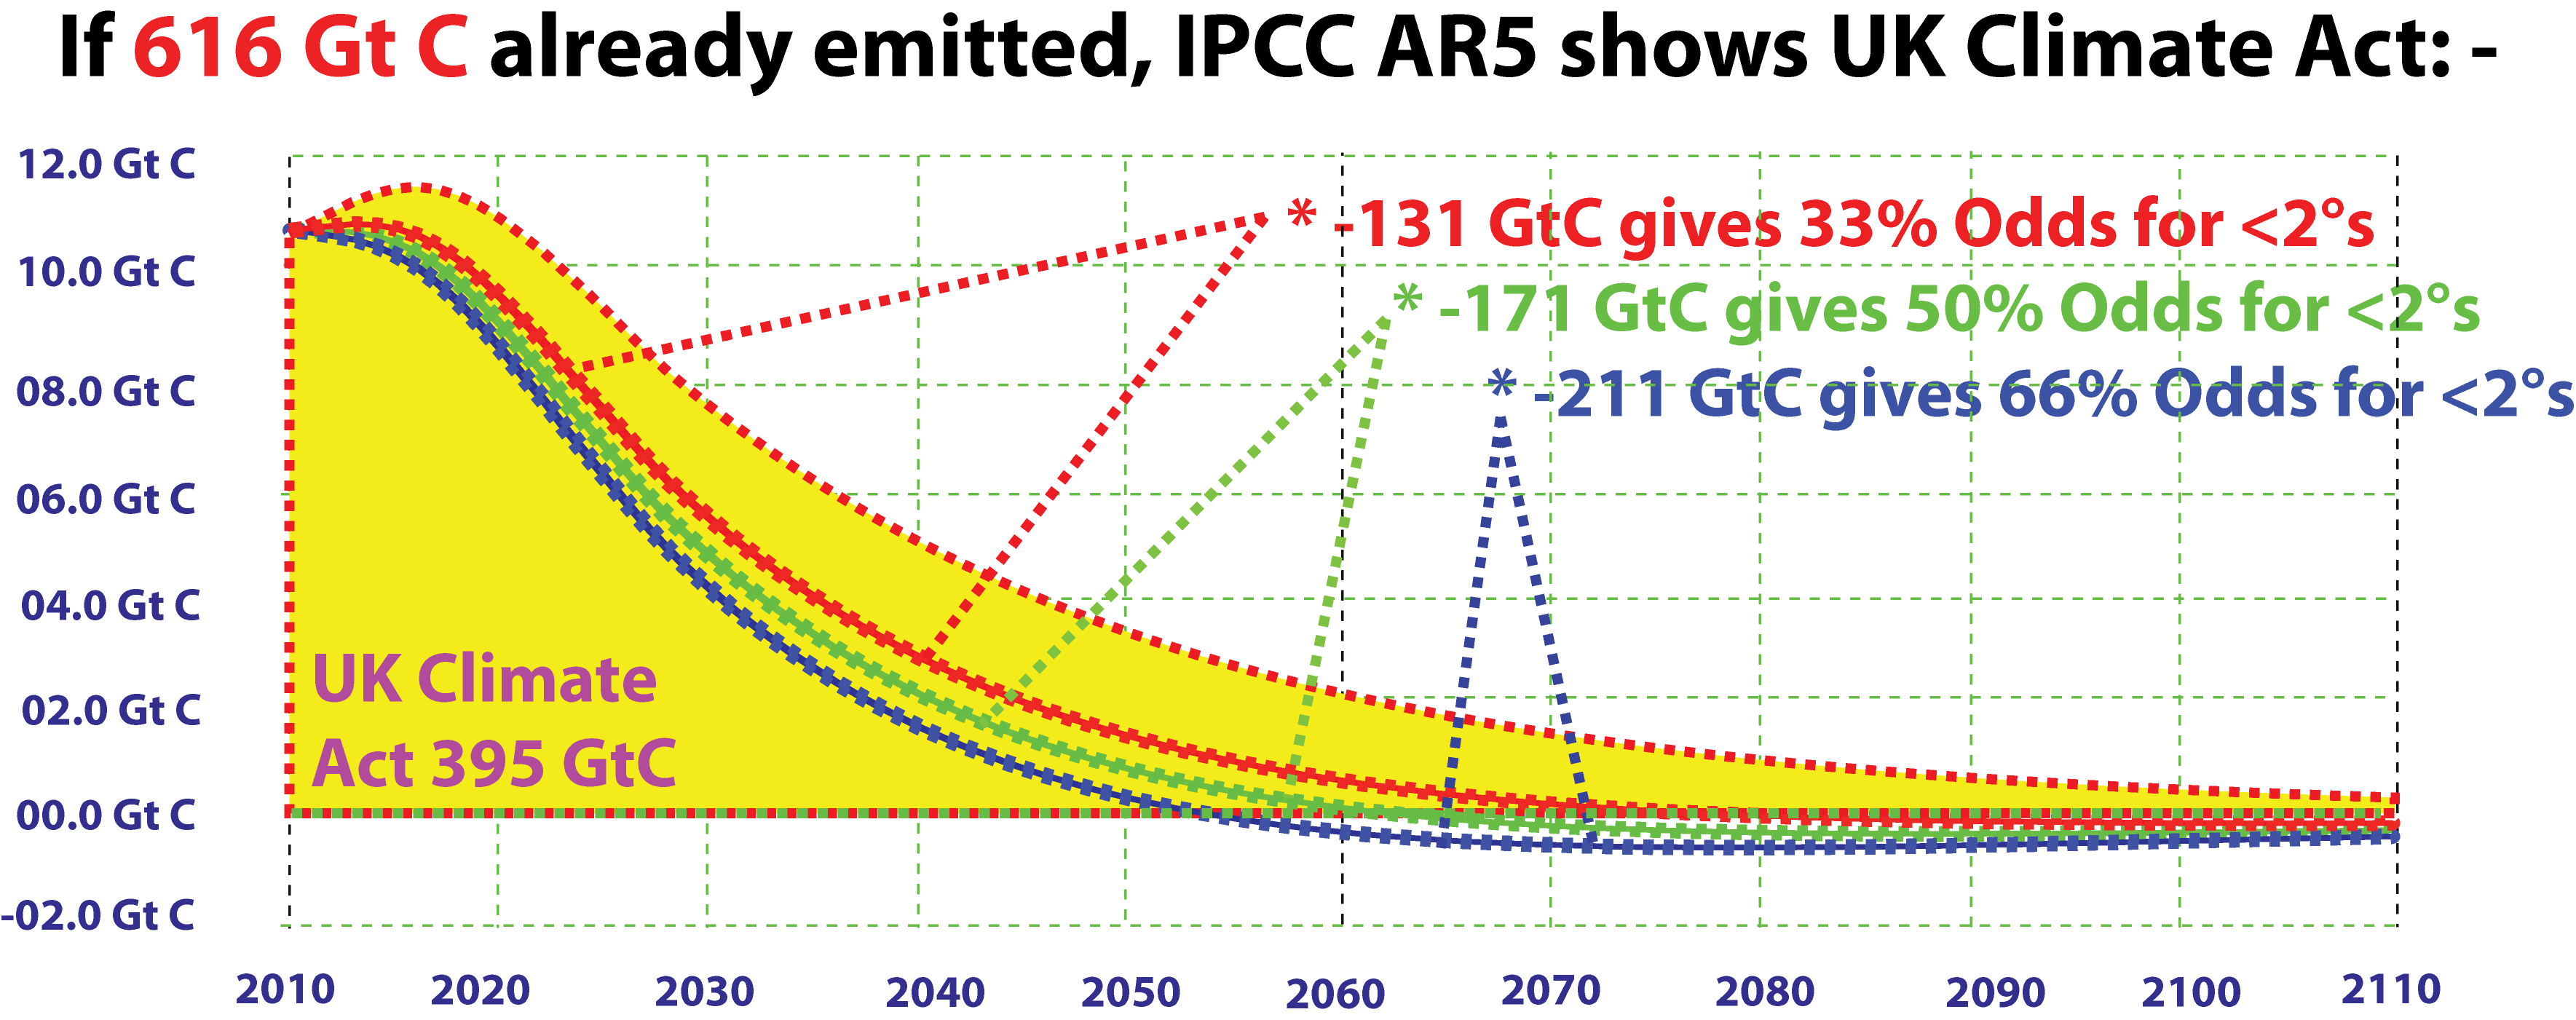
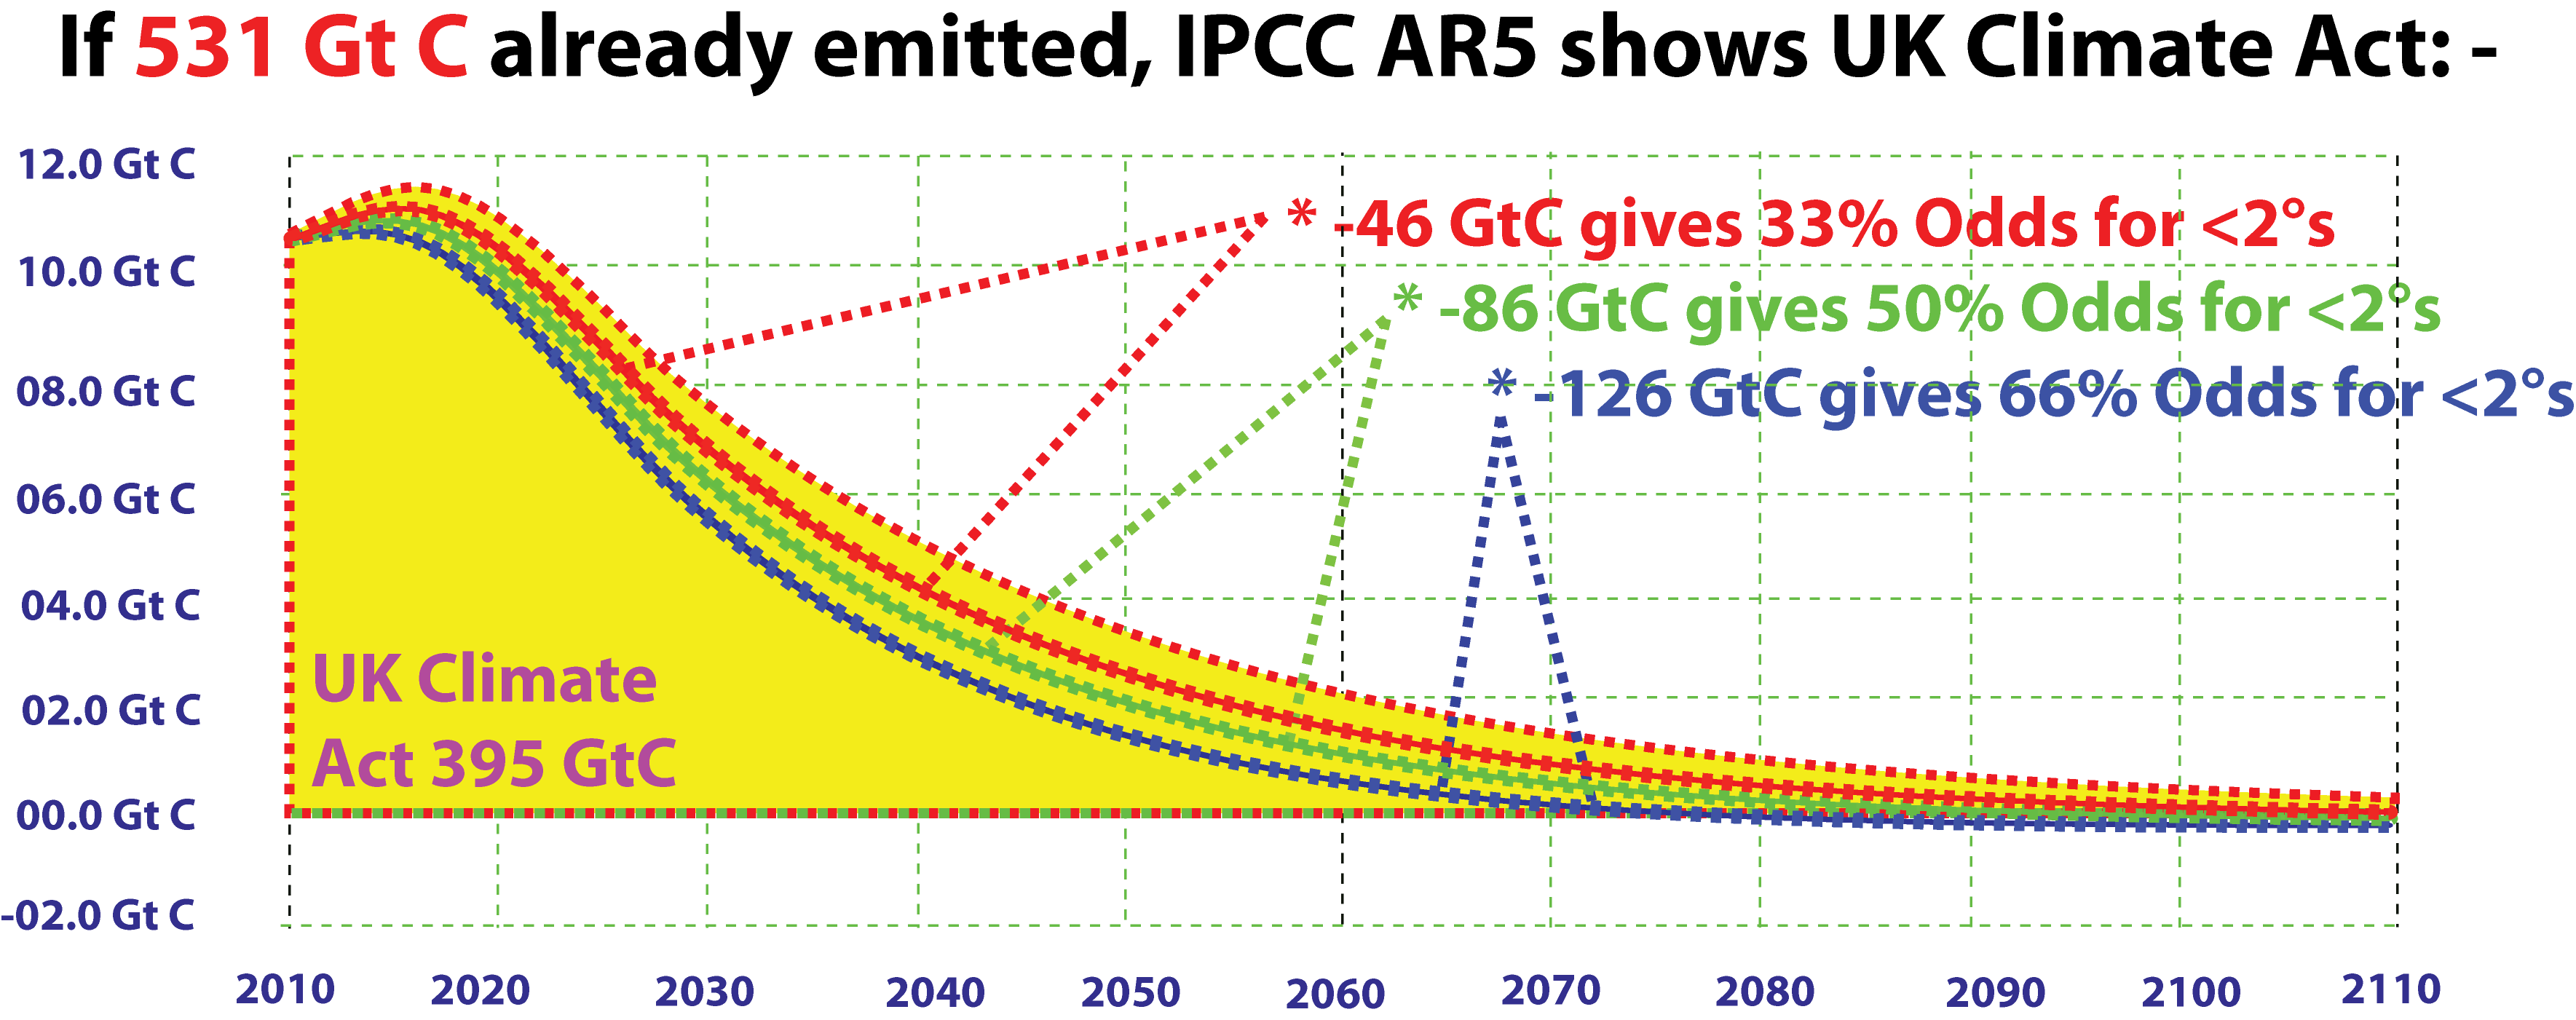
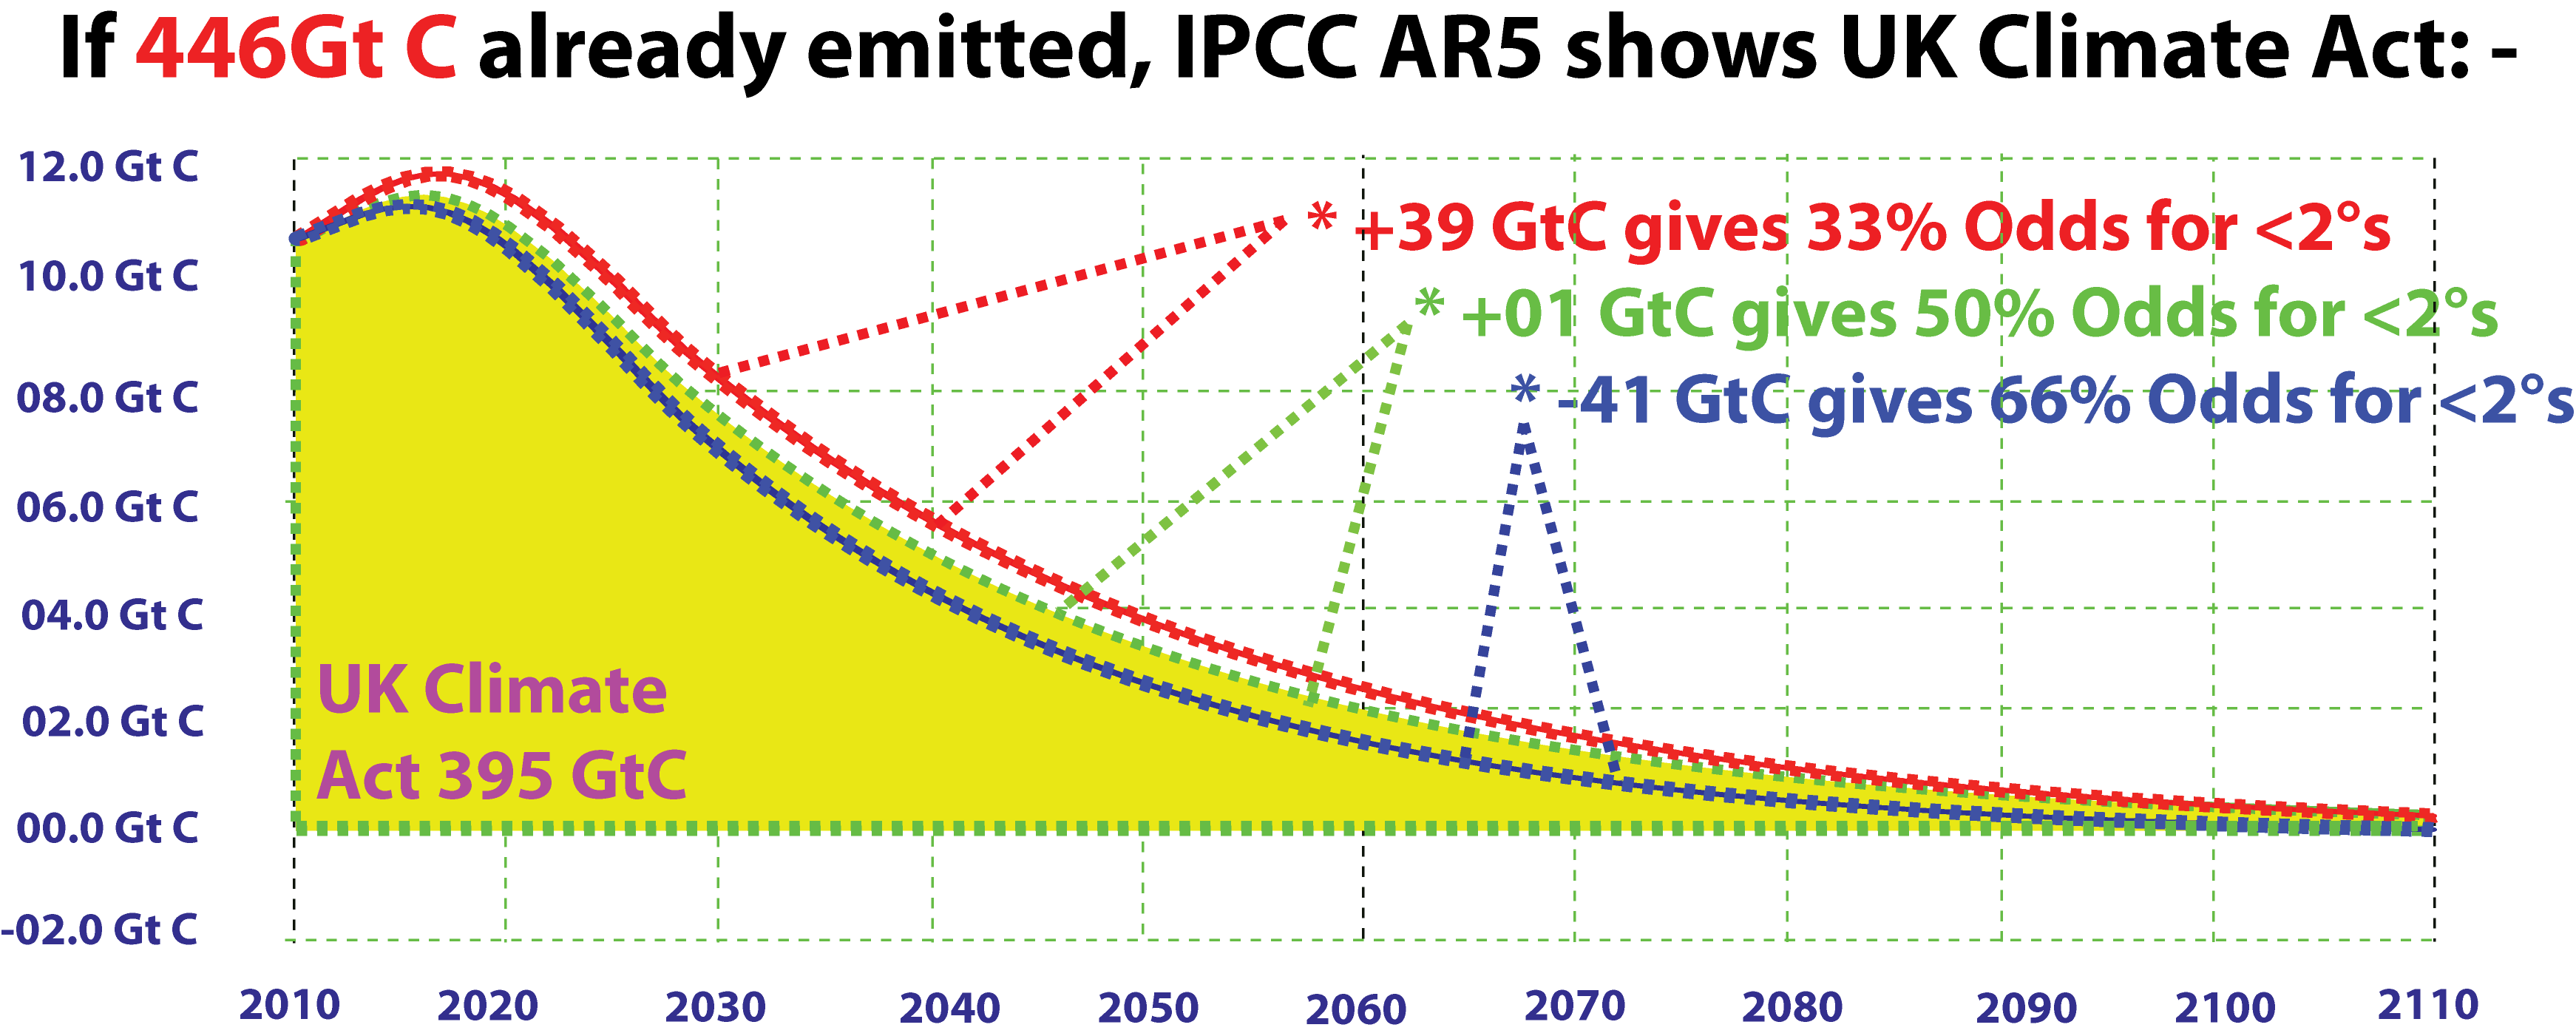
Here is a graphic comparing the UK Climate Act with the IPCC AR5 . . .
It is widely suspected that above the 2 degrees Maximum [agreed at COP-15] runaway rates of climate change will have taken hold and bio-conditions akin to the Permian extinction 251 million years ago will come to prevail.
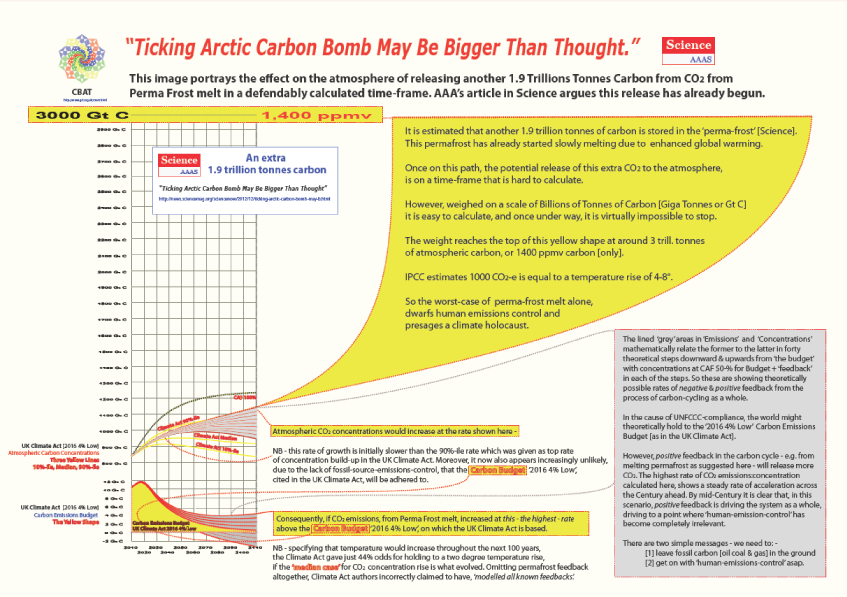
Here is the UK Climate Act in relation to just the revised estimates of CO2 stored under the Arctic Permafrost published in AAAS Science.
All this was all in the GCI evidence to the Environmental Audit Committee [EAC] Parliamentary Enquiry in June 2013. As part of its perjury to the EAC Enquiry, the UKMO denounced all this as, "completely untrue."
DECC's letter, following that example, provides an example where DECC civil servants in this letter also actively misrepresent and disinform the public.
~~~~~~~~~~~~~~~~~~~~~~~~~~~~
Here are all the RCP scenarios that form the basis of IPCC AR5.
In this SPM, IPCC AR5's 'carbon-budgeting' has 3 results each with 3 'probability-levels' for keeping within the '2 degrees Celsius' limit agreed at COP-15 in Copenhagen in 2009
The: -
First result effectively says, ‘halve the UKCA’.
Second result says, ‘reduce UKCA by up to a third.’
Third result [50% odds] effectively says, 'the UKCA is just fine.'
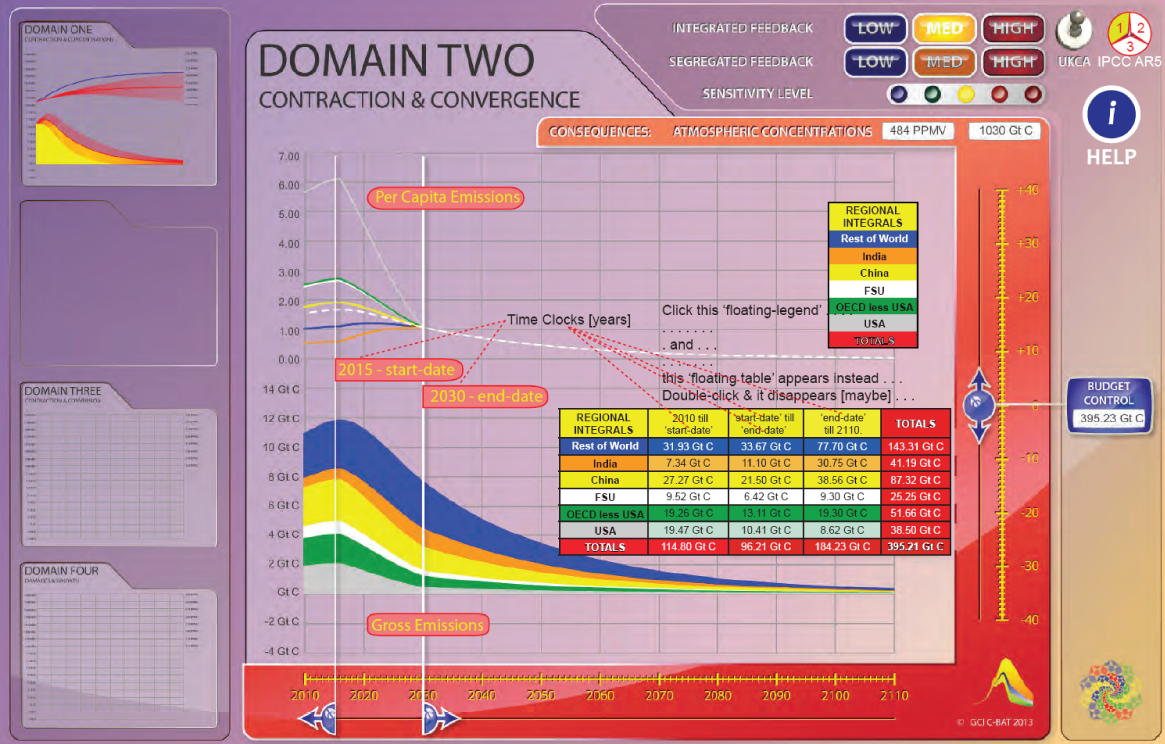
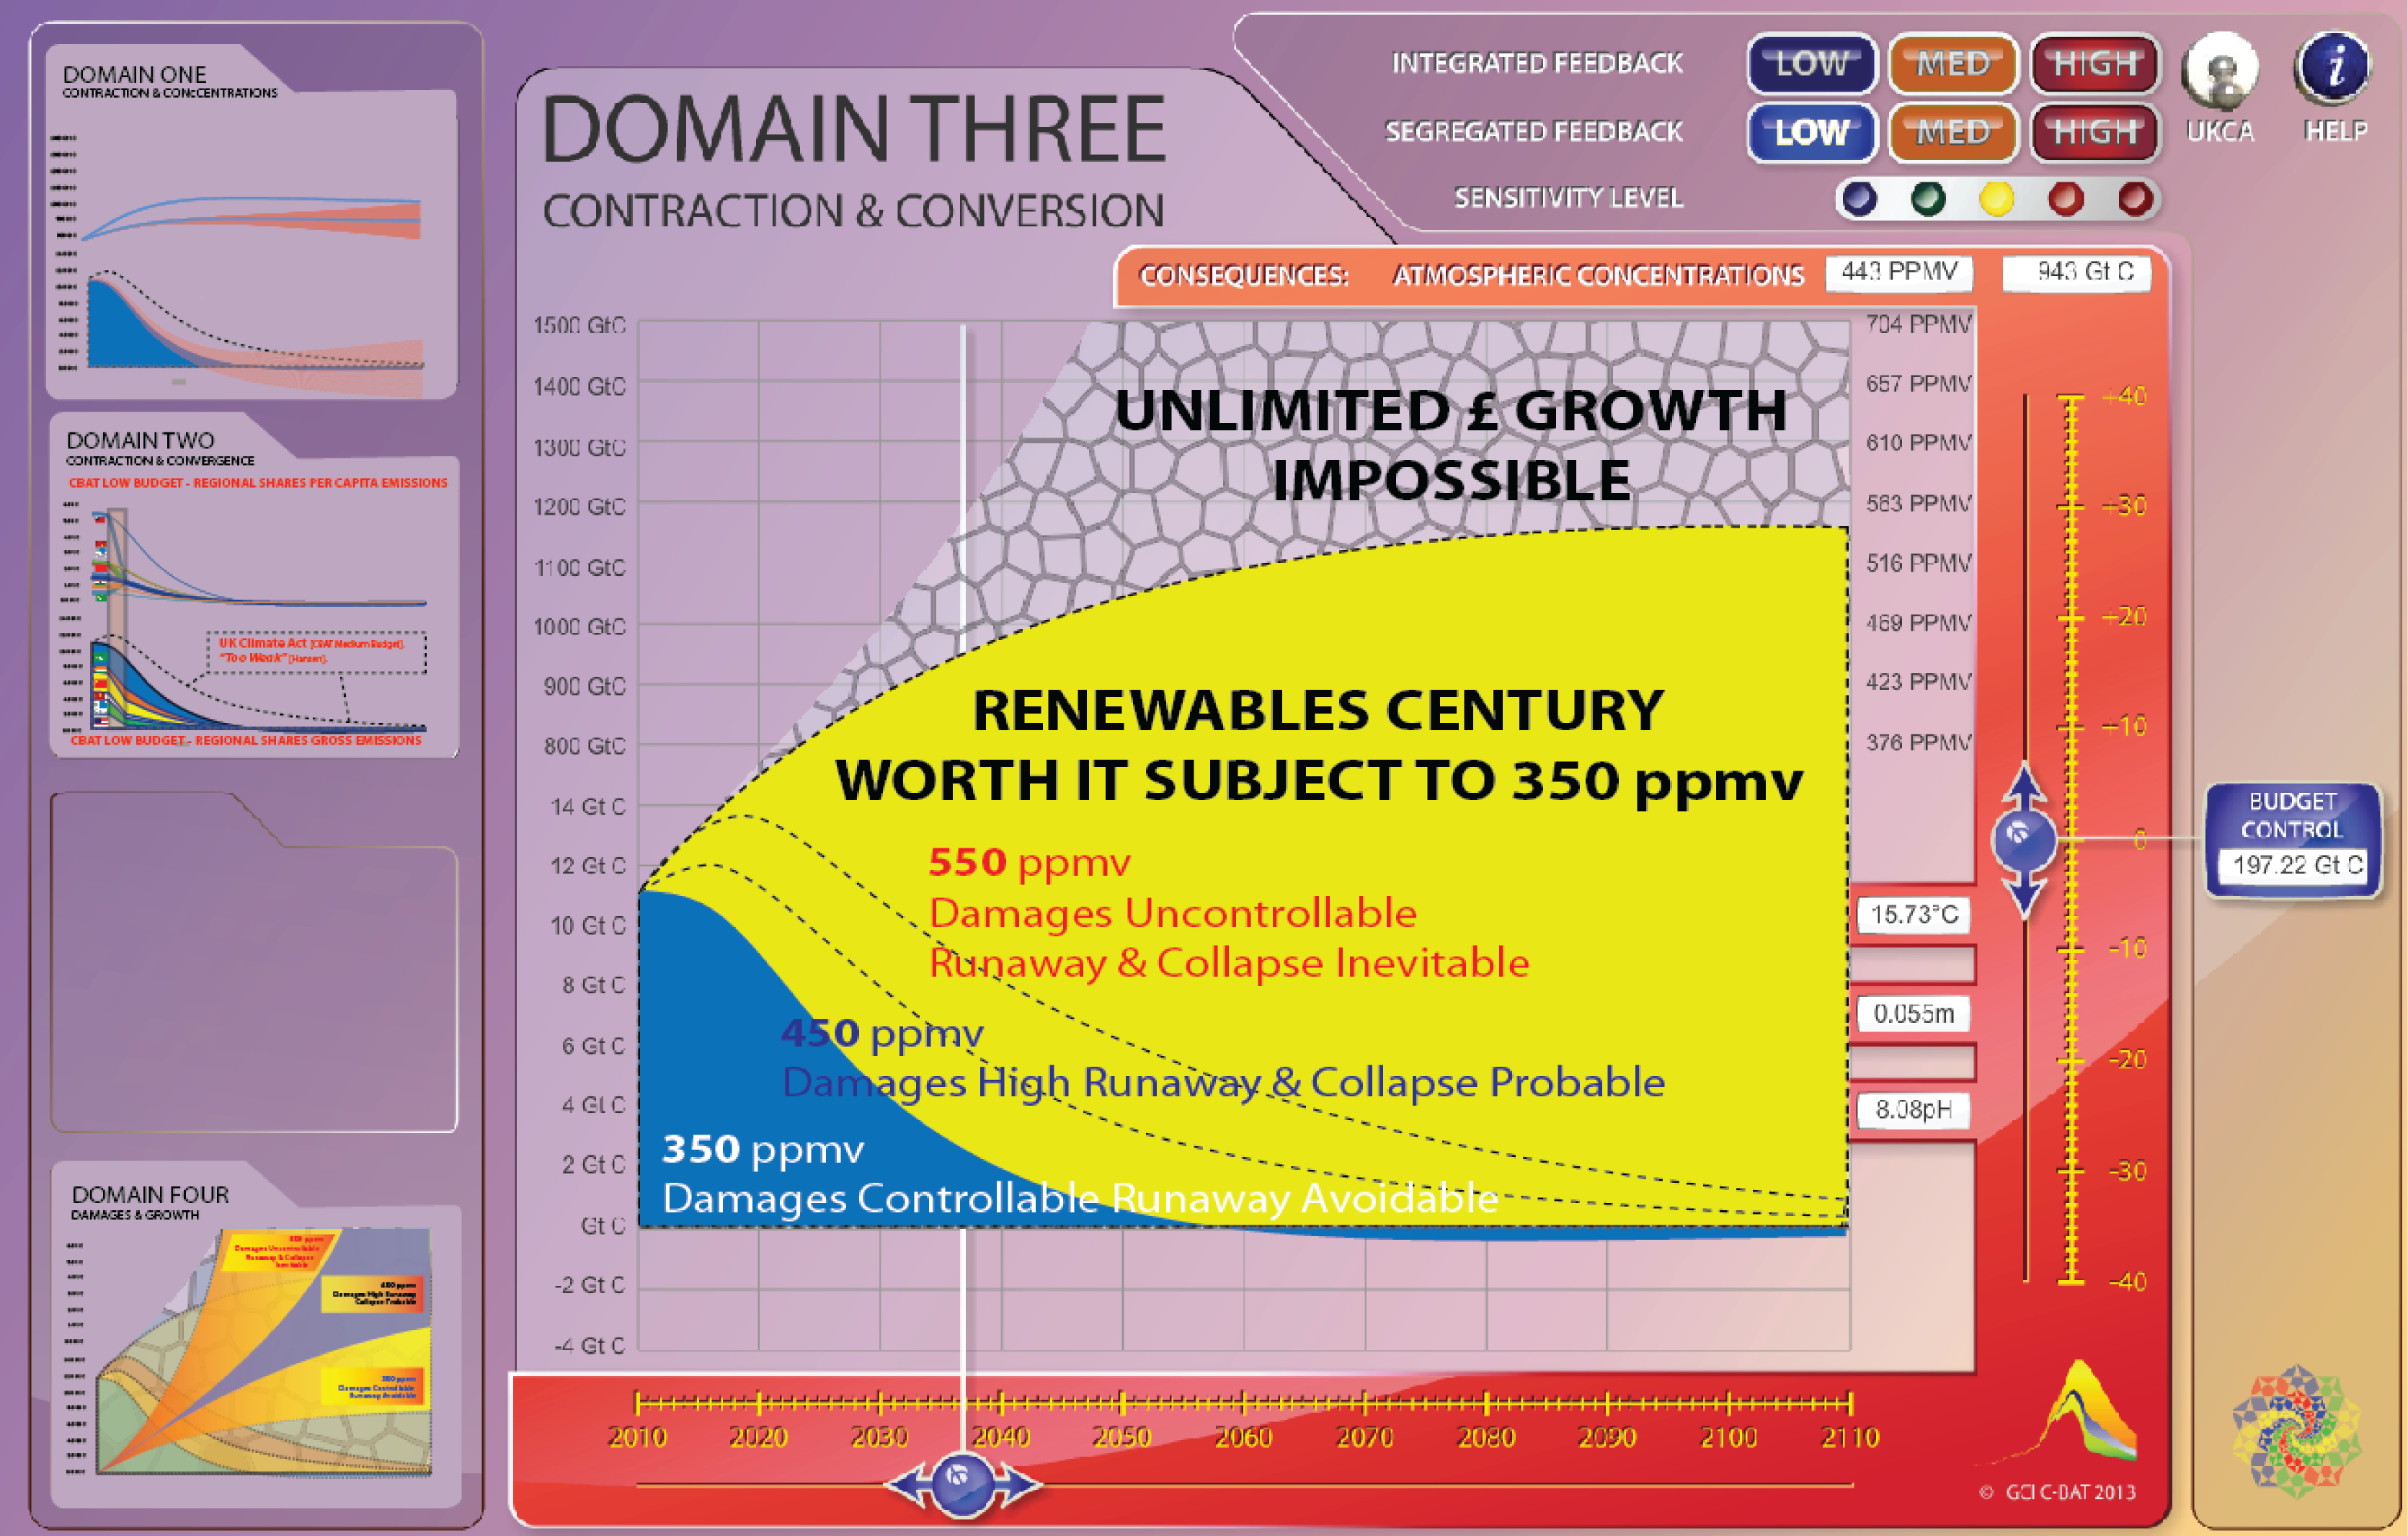
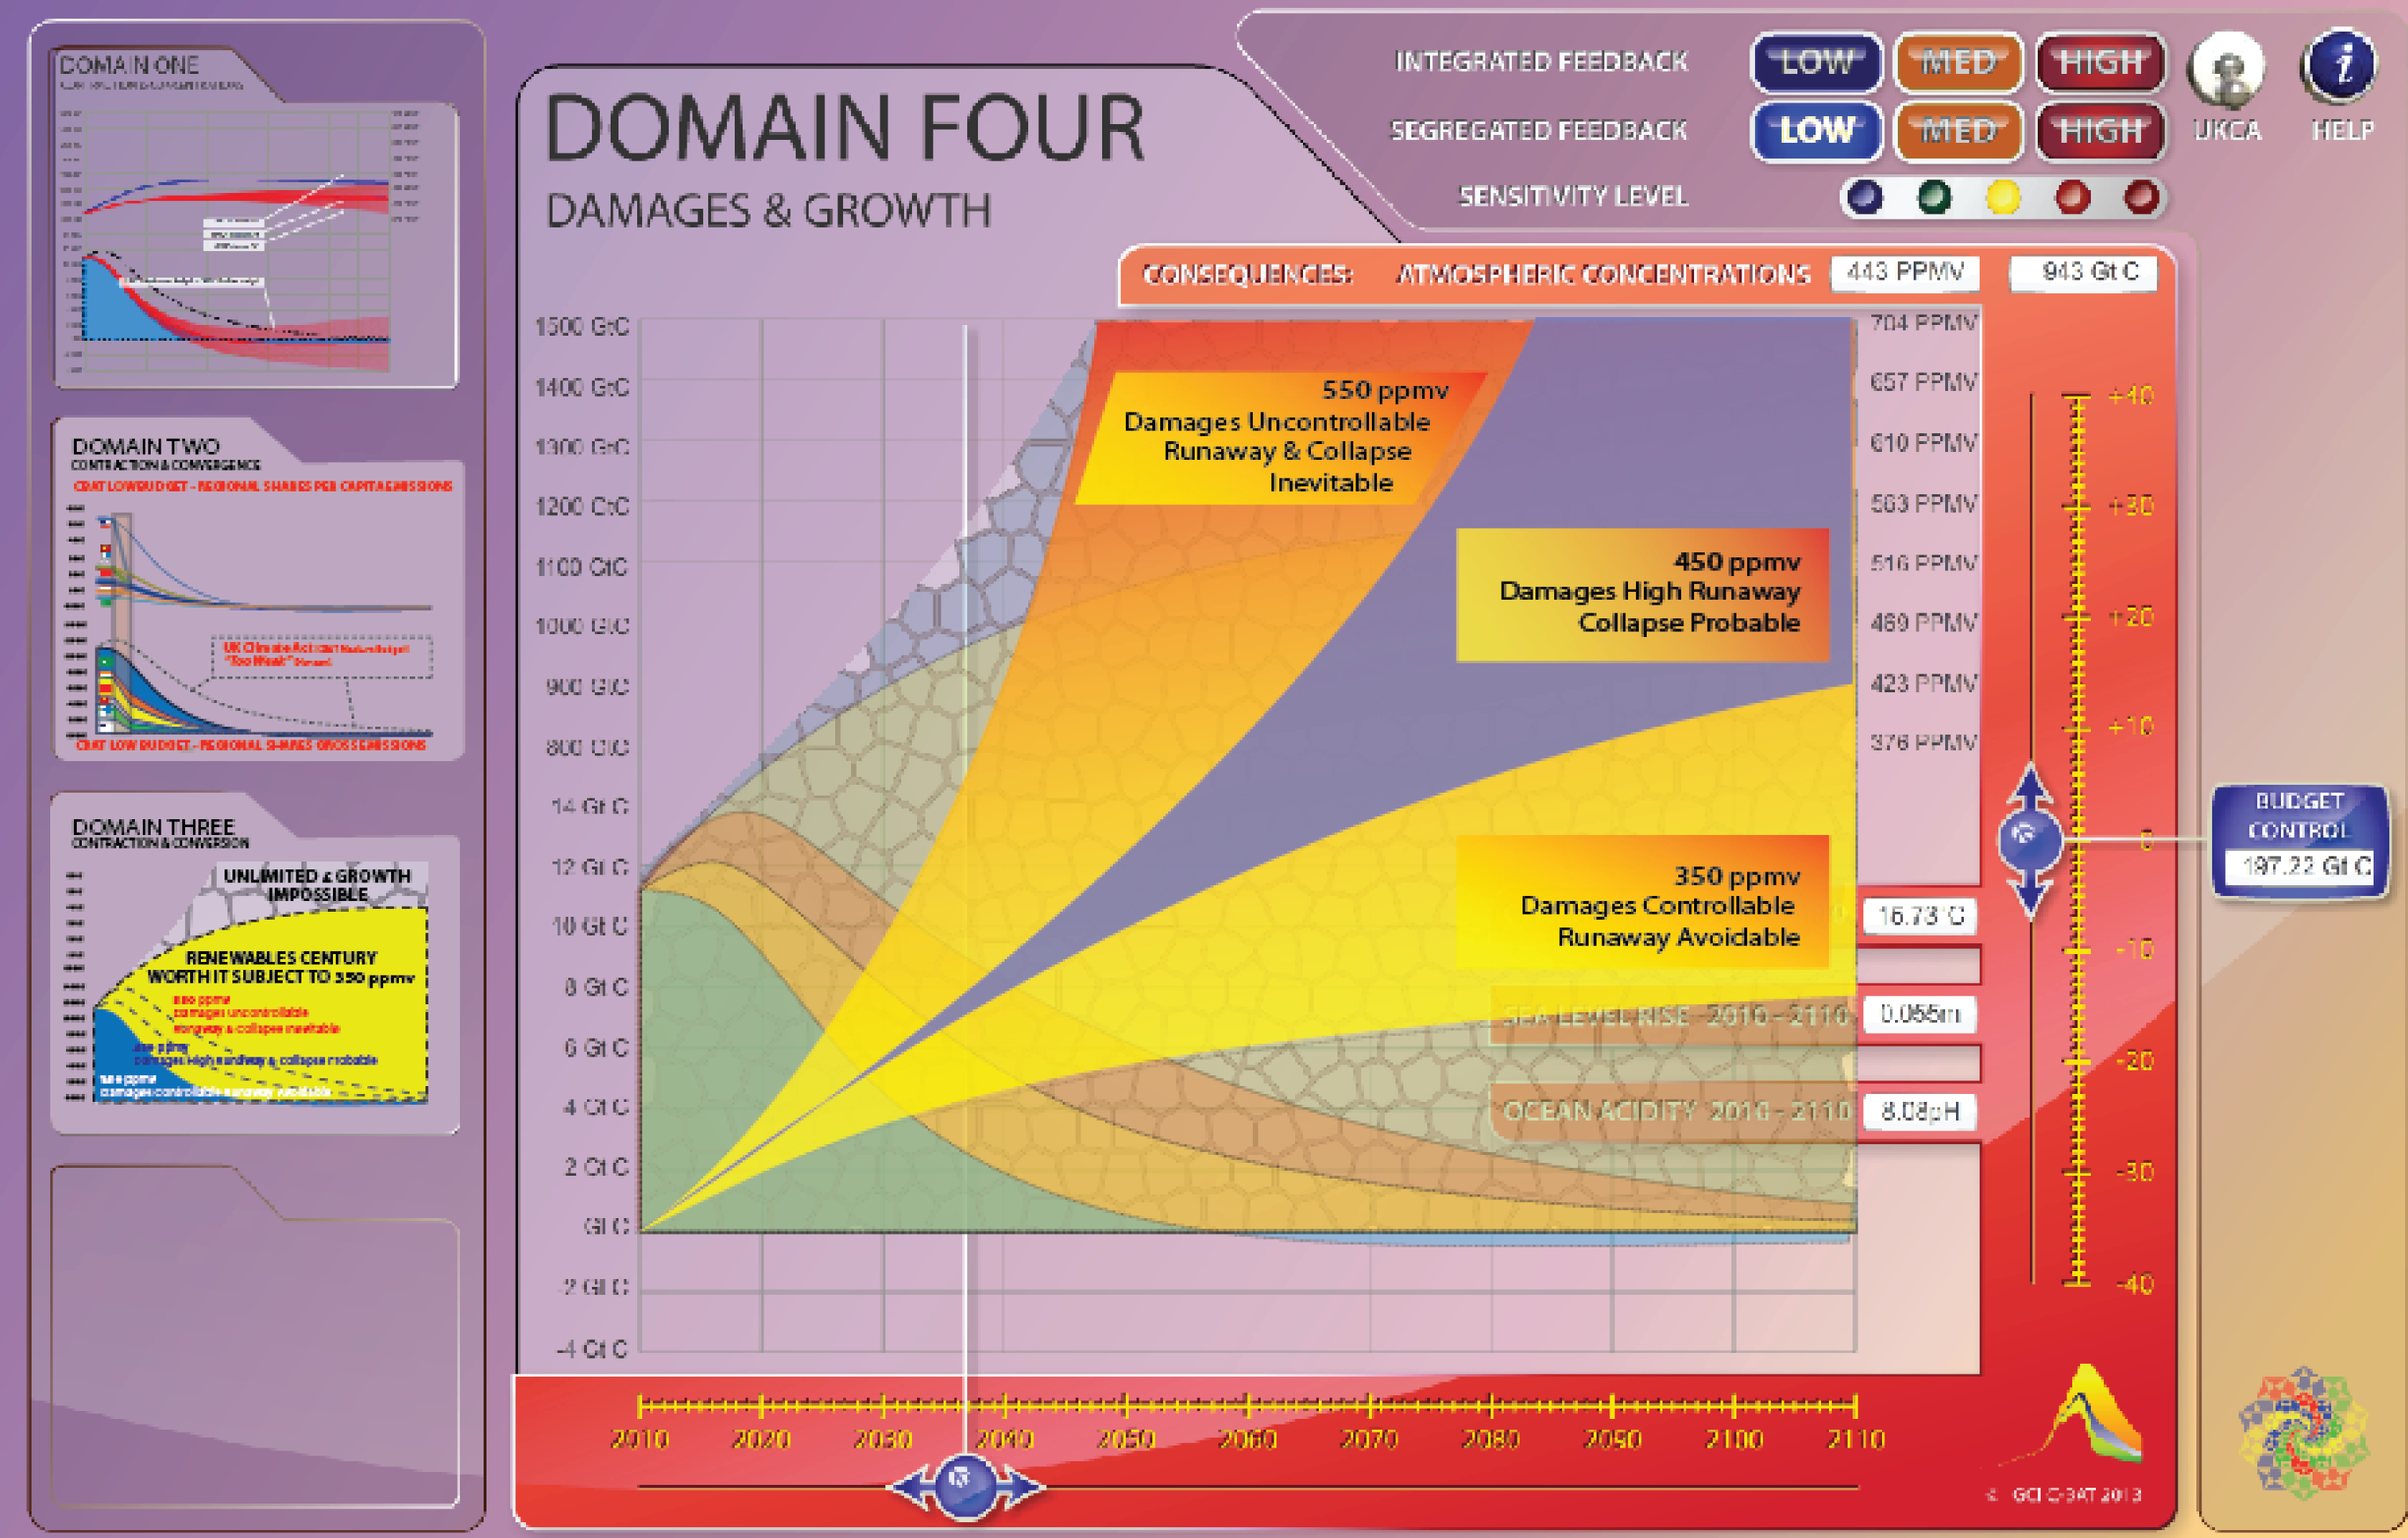
Using CBAT it is straightforward relating these results to the UKMO's UK Climate Act
Set on-screen UKCA [UK Climate Act] toggle-switch to 'ON' and use slider - also see below.
The emissions-budget [path-integral] of 395 Gt C 2010 - 2100 [in yellow] is the carbon-budget in the UKCA.
Despite these omissions,
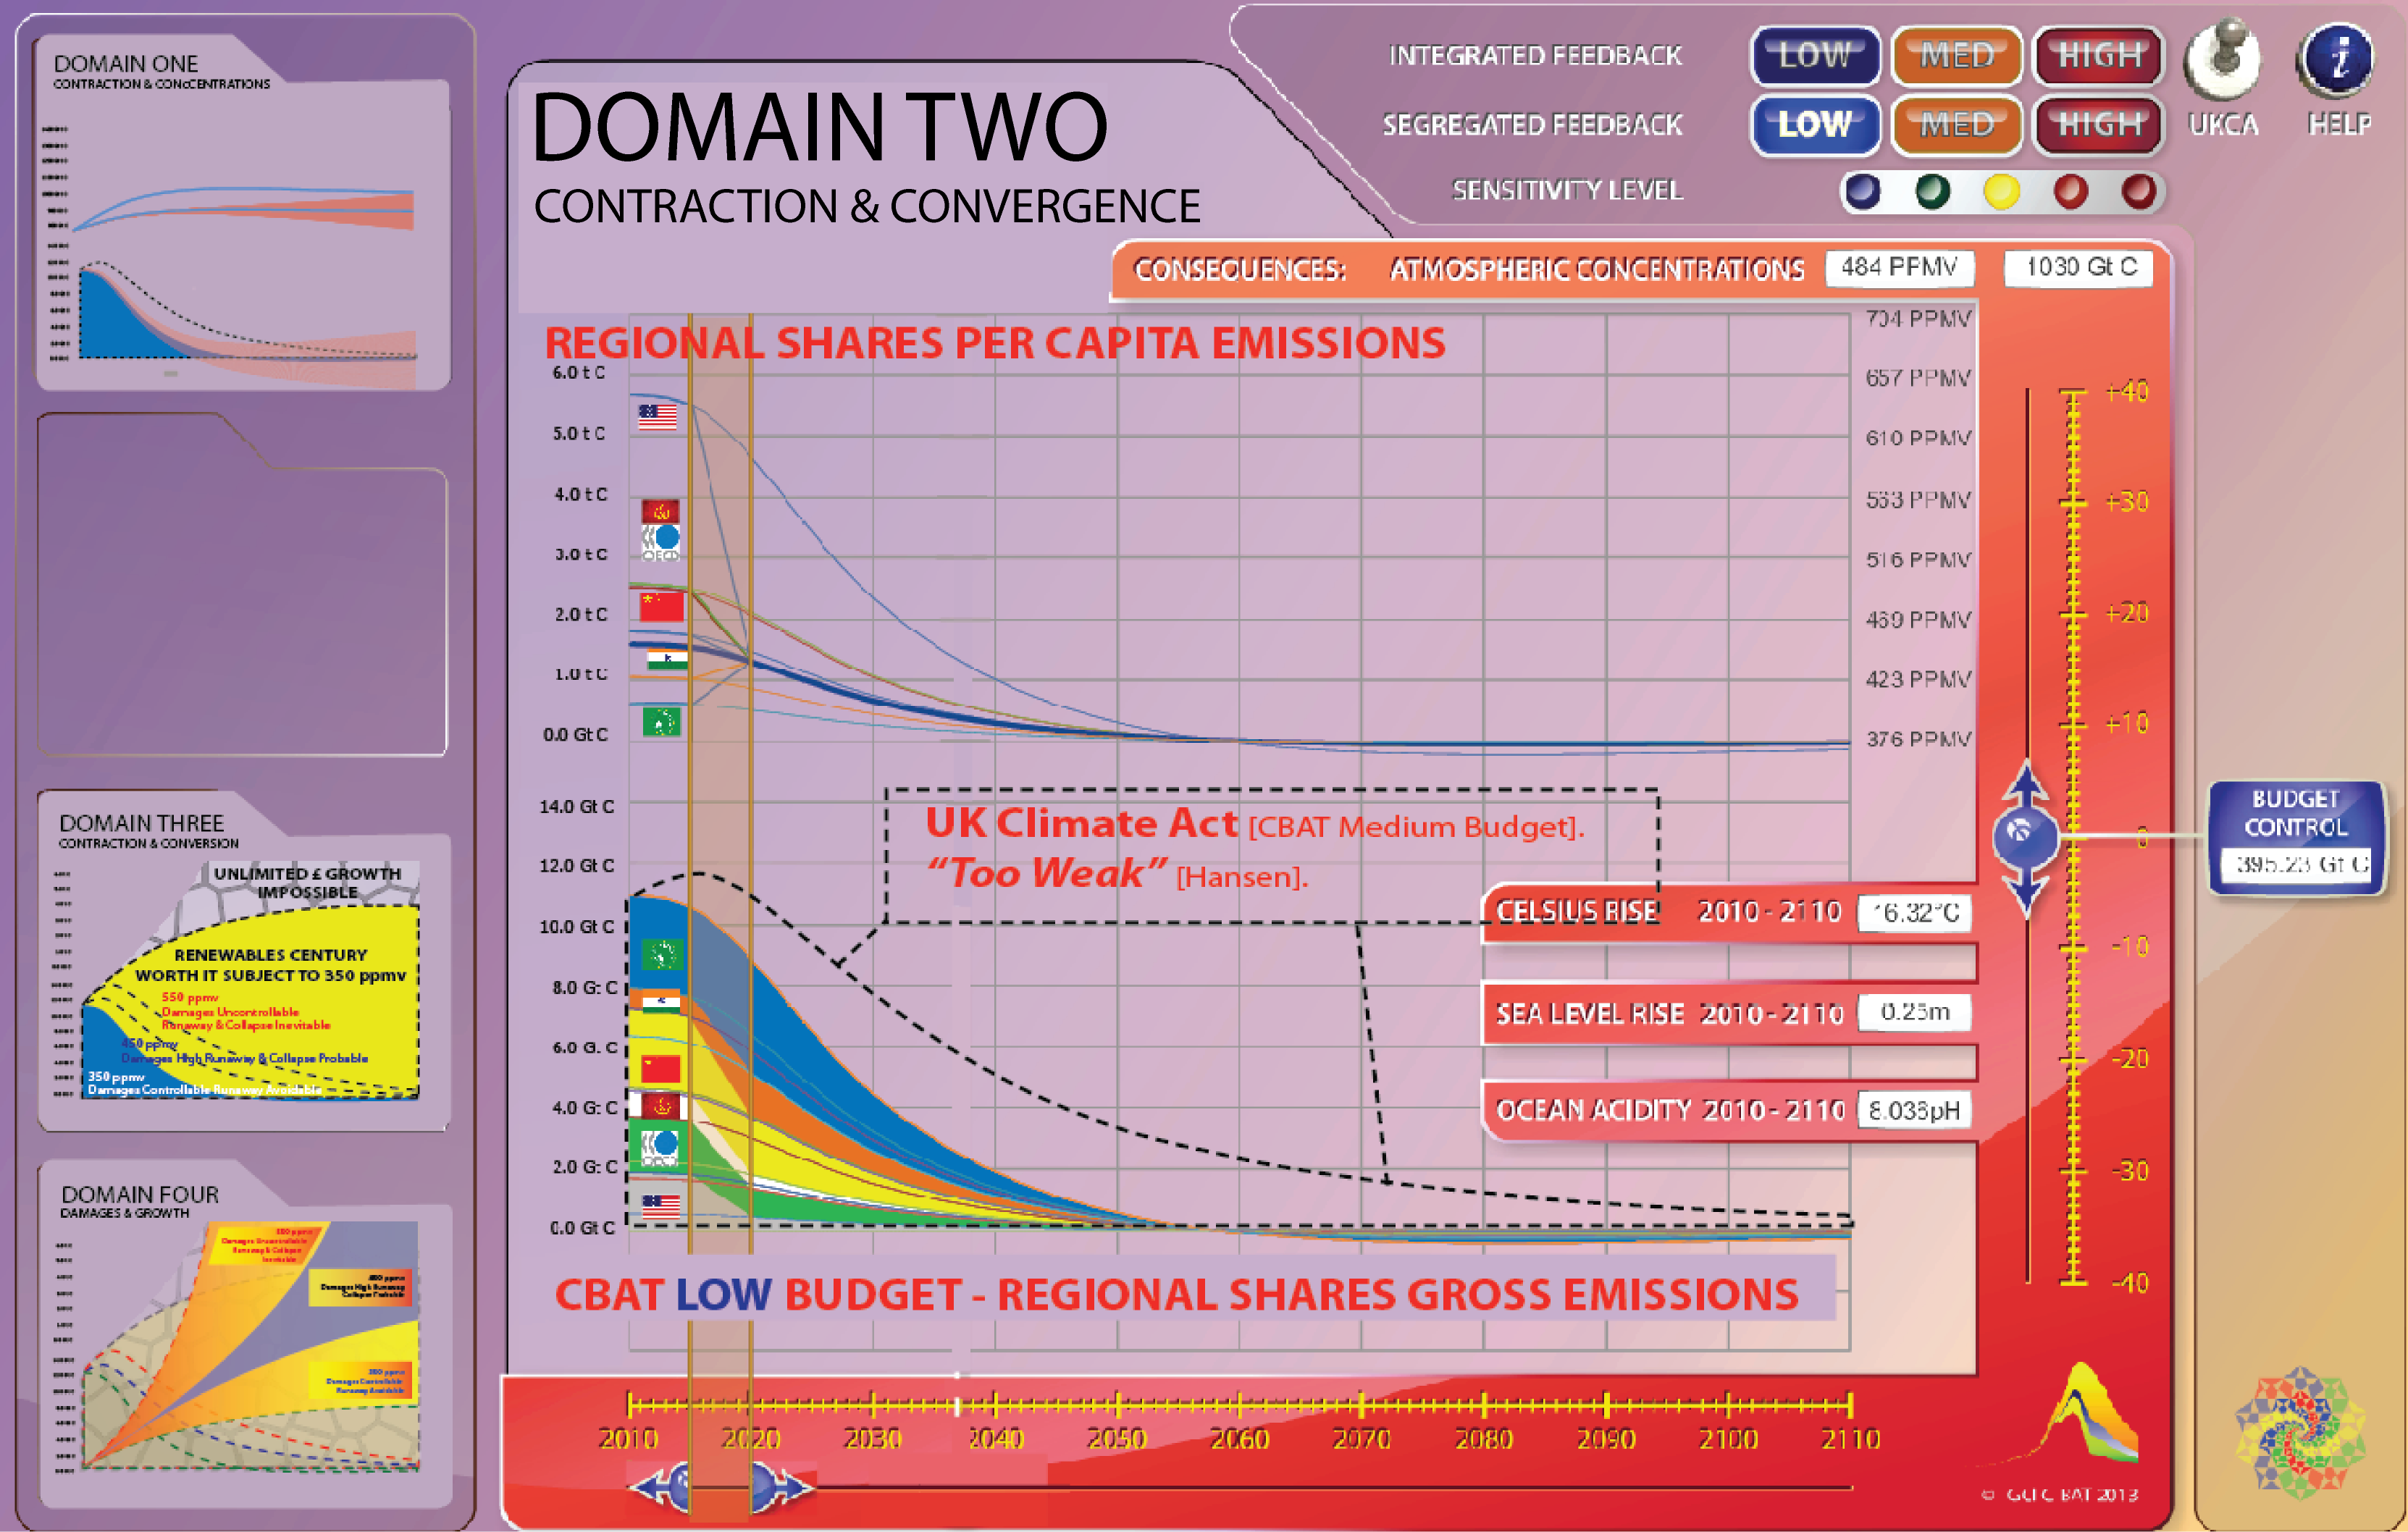
the UKMO will perhaps see this as a vindication of the UK Climate Act. On the other hand it could be seen as vindicating the position of those like Jim Hansen who told the UK Environmental Audit Committee Enquiry into the UKCA recently that it is "too weak".
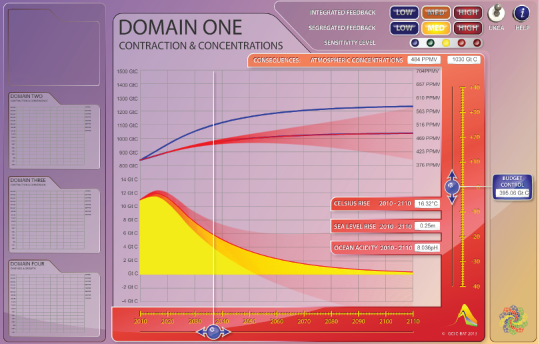
When Domain Two is fully operational, it will look like this: -
. . . where both the: -
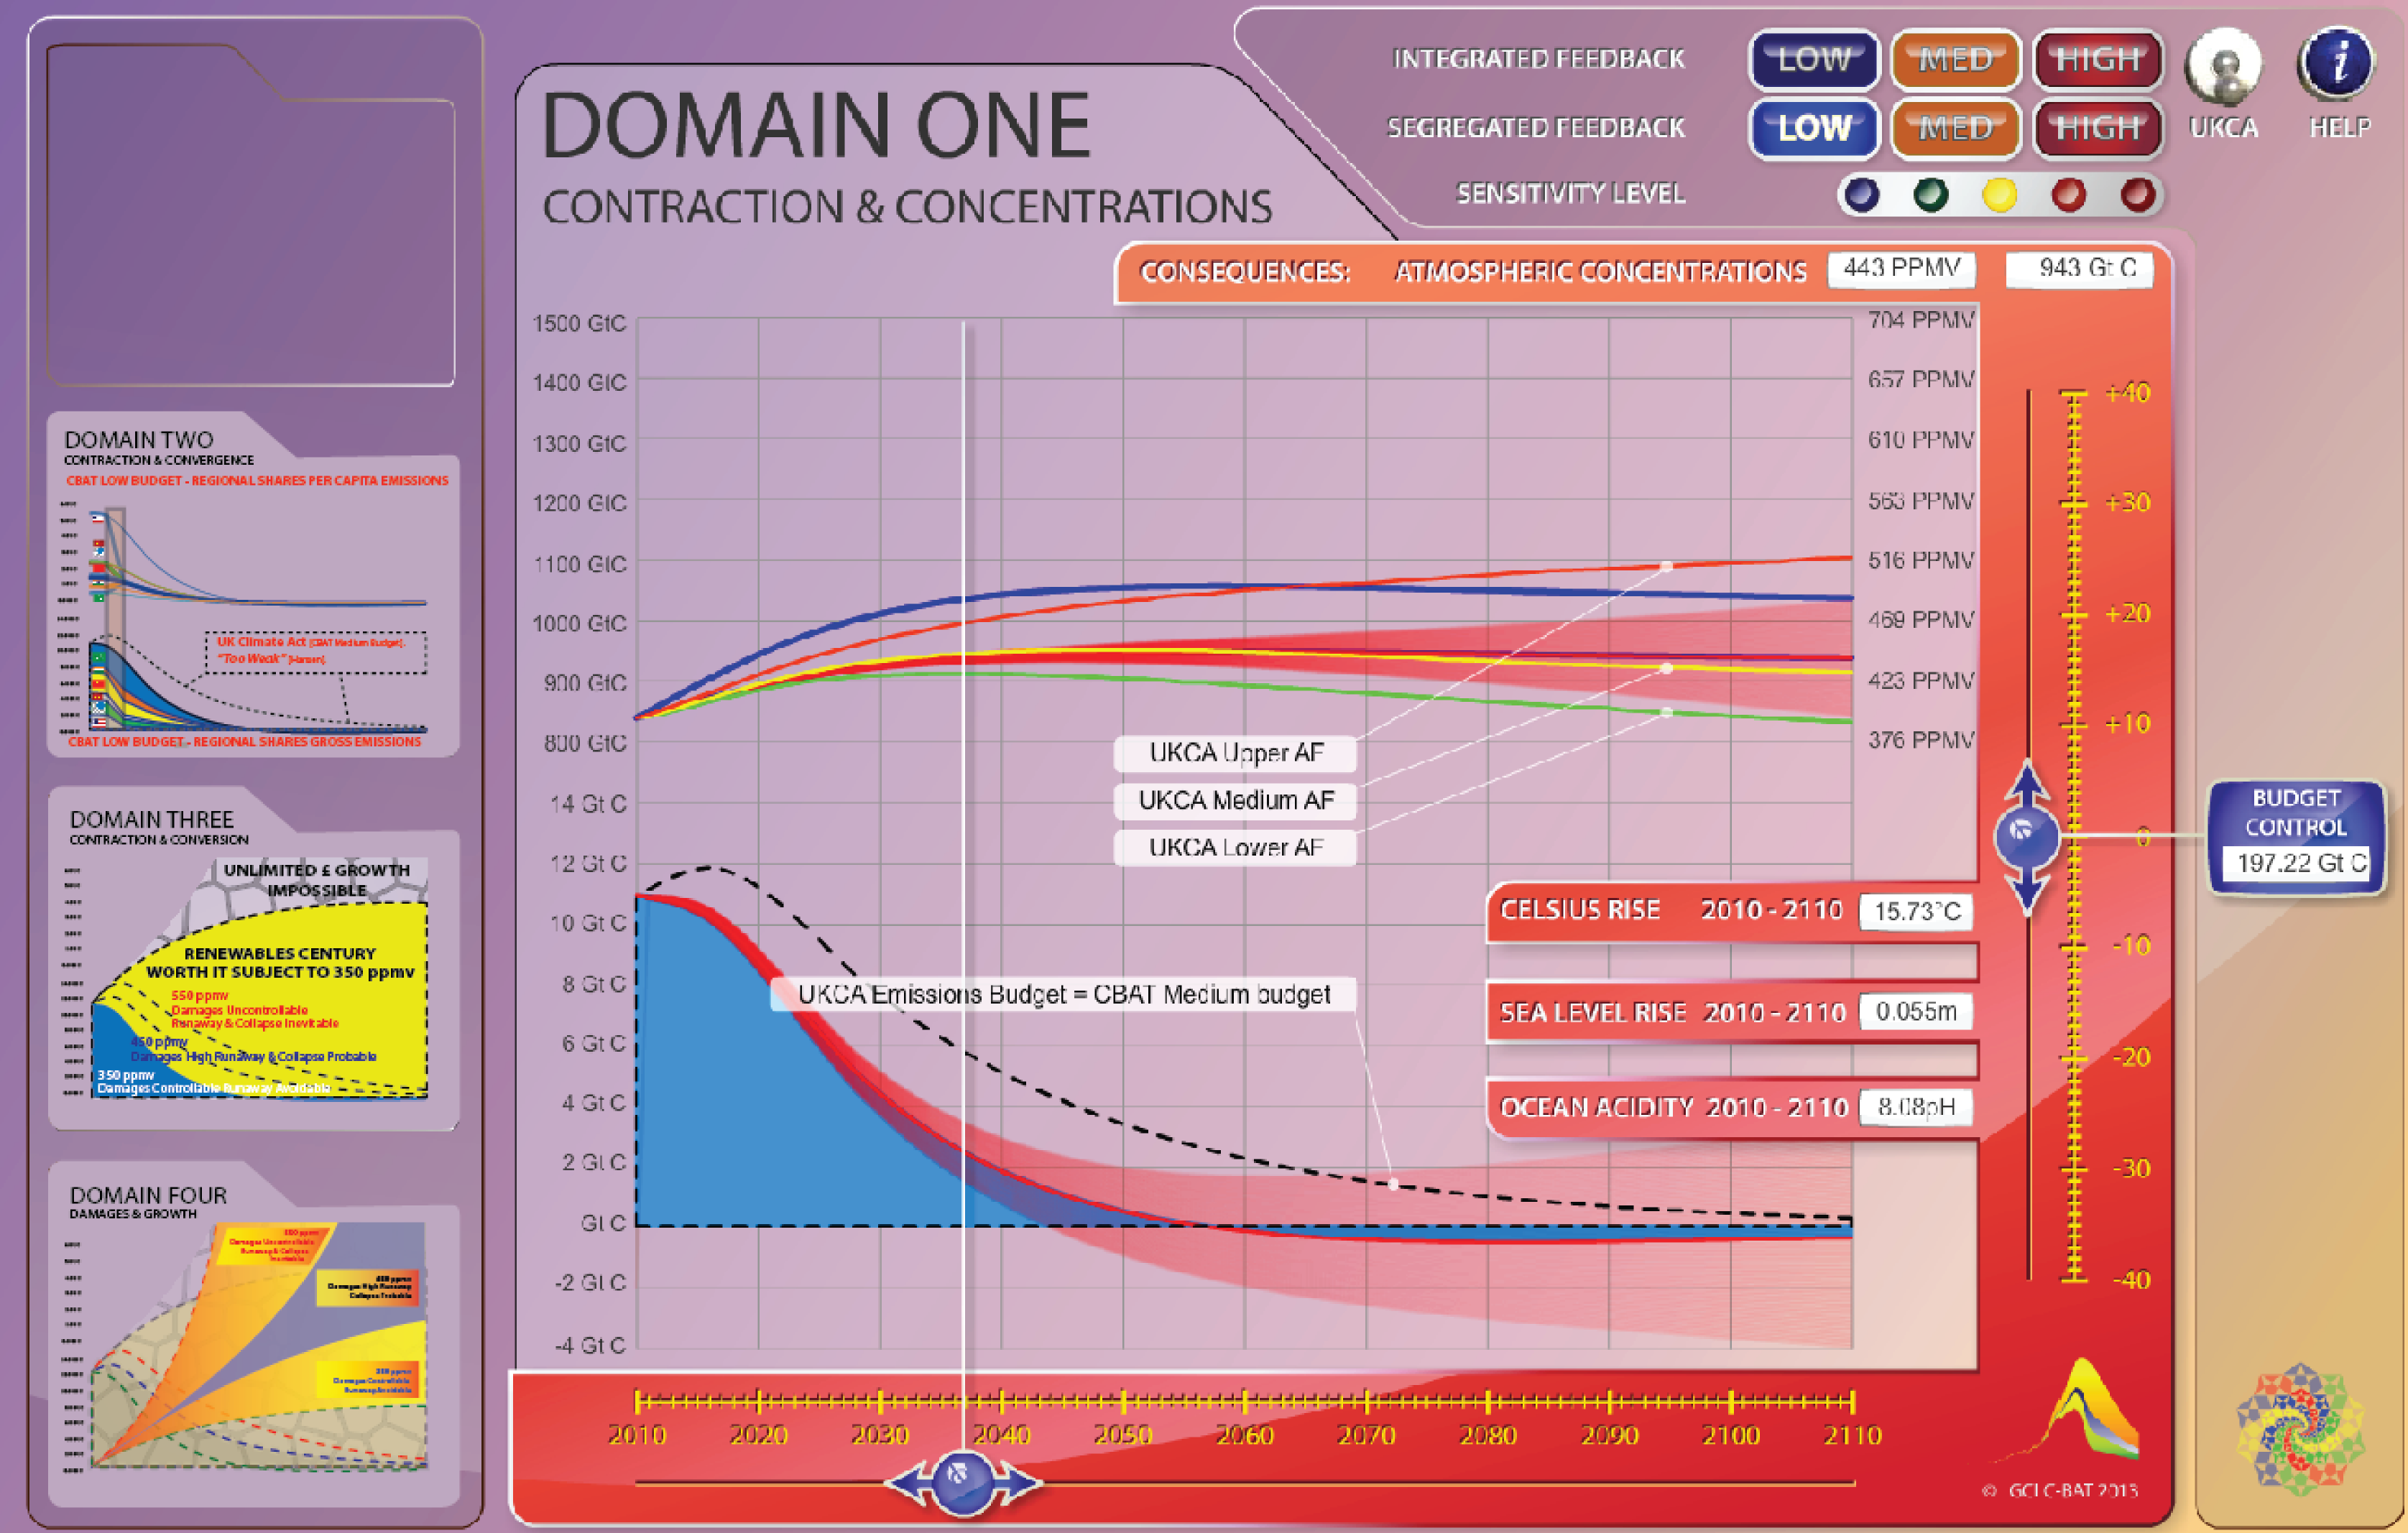
Vertical Slider ['y' axis] for Domain One and the
Horzontal Slider ['x' axis] for Domain Two and the
Table of values for Domain Two shown in the image above
. . . will be adjusting to read any Domain One/Domain Two combination chosen by the user.
That means that for any relevant rate of Contraction with any rate of Convergence arising . . .
. . . . CBAT will calculate instantly and show from any of the: -
Three Carbon Budgets, [three buttons LOW, MEDIUM, HIGH, top right] multiplied by
80 positions each [from +40 to -40 - VERTICAL SLIDER] multiplied by
Any convergence start-date [2010-2110 - HORIZONTAL SLIDER] multiplied by
Any convergence end-date [2010-2110 or 100 years] [HORIZONTAL SLIDER]
. . . giving 2.4 million 'C&C' Carbon-Budget options, where 'Contraction' and 'Convergence' totals 'commute' [are the same].
This means in turn that the 'Budget-Total-Clock' on Vertical Slider and the 'Budget-Table-Total' will always show the same quantity of tonnes of carbon in the same path-integrals [shape and weight of budgets in Gt C], no matter which user-positions the SLIDERS are pushed to.
Basically this establishes that the 'numeraire' [unit of measurement] is the tonne of carbon, before it embraces the derivative dollars-per-tonne ['carbon-pricing'] arising in Domains Three and Four.