| |
The Carbon Budget Accounting Tool (CBAT) showing 4 different views of the same 'carbon-contraction-event' - in '4 Domains'
 . .  
. . . . . . . . . Contraction & Concentrations . . . . . . . . . . . Contraction & Convergence . . . . . . . . . . . . . . Contraction & Conversion . . . . . . . . . . . . . . . . . . Damages & Growth
- Notes CBAT Notes. Using the CBAT heuristic device, whatever weight of carbon-budget is chosen, it automatically sets the same in all 4 CBAT 'Domains'.
- Narrative (how we got here)
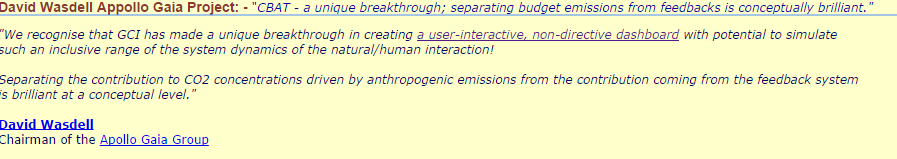
- Appreciation (how others see it - pdf)
- CBAT & Phi (the underlying 'concept-constitution' of CBAT)
- CBAT 'Explanation'
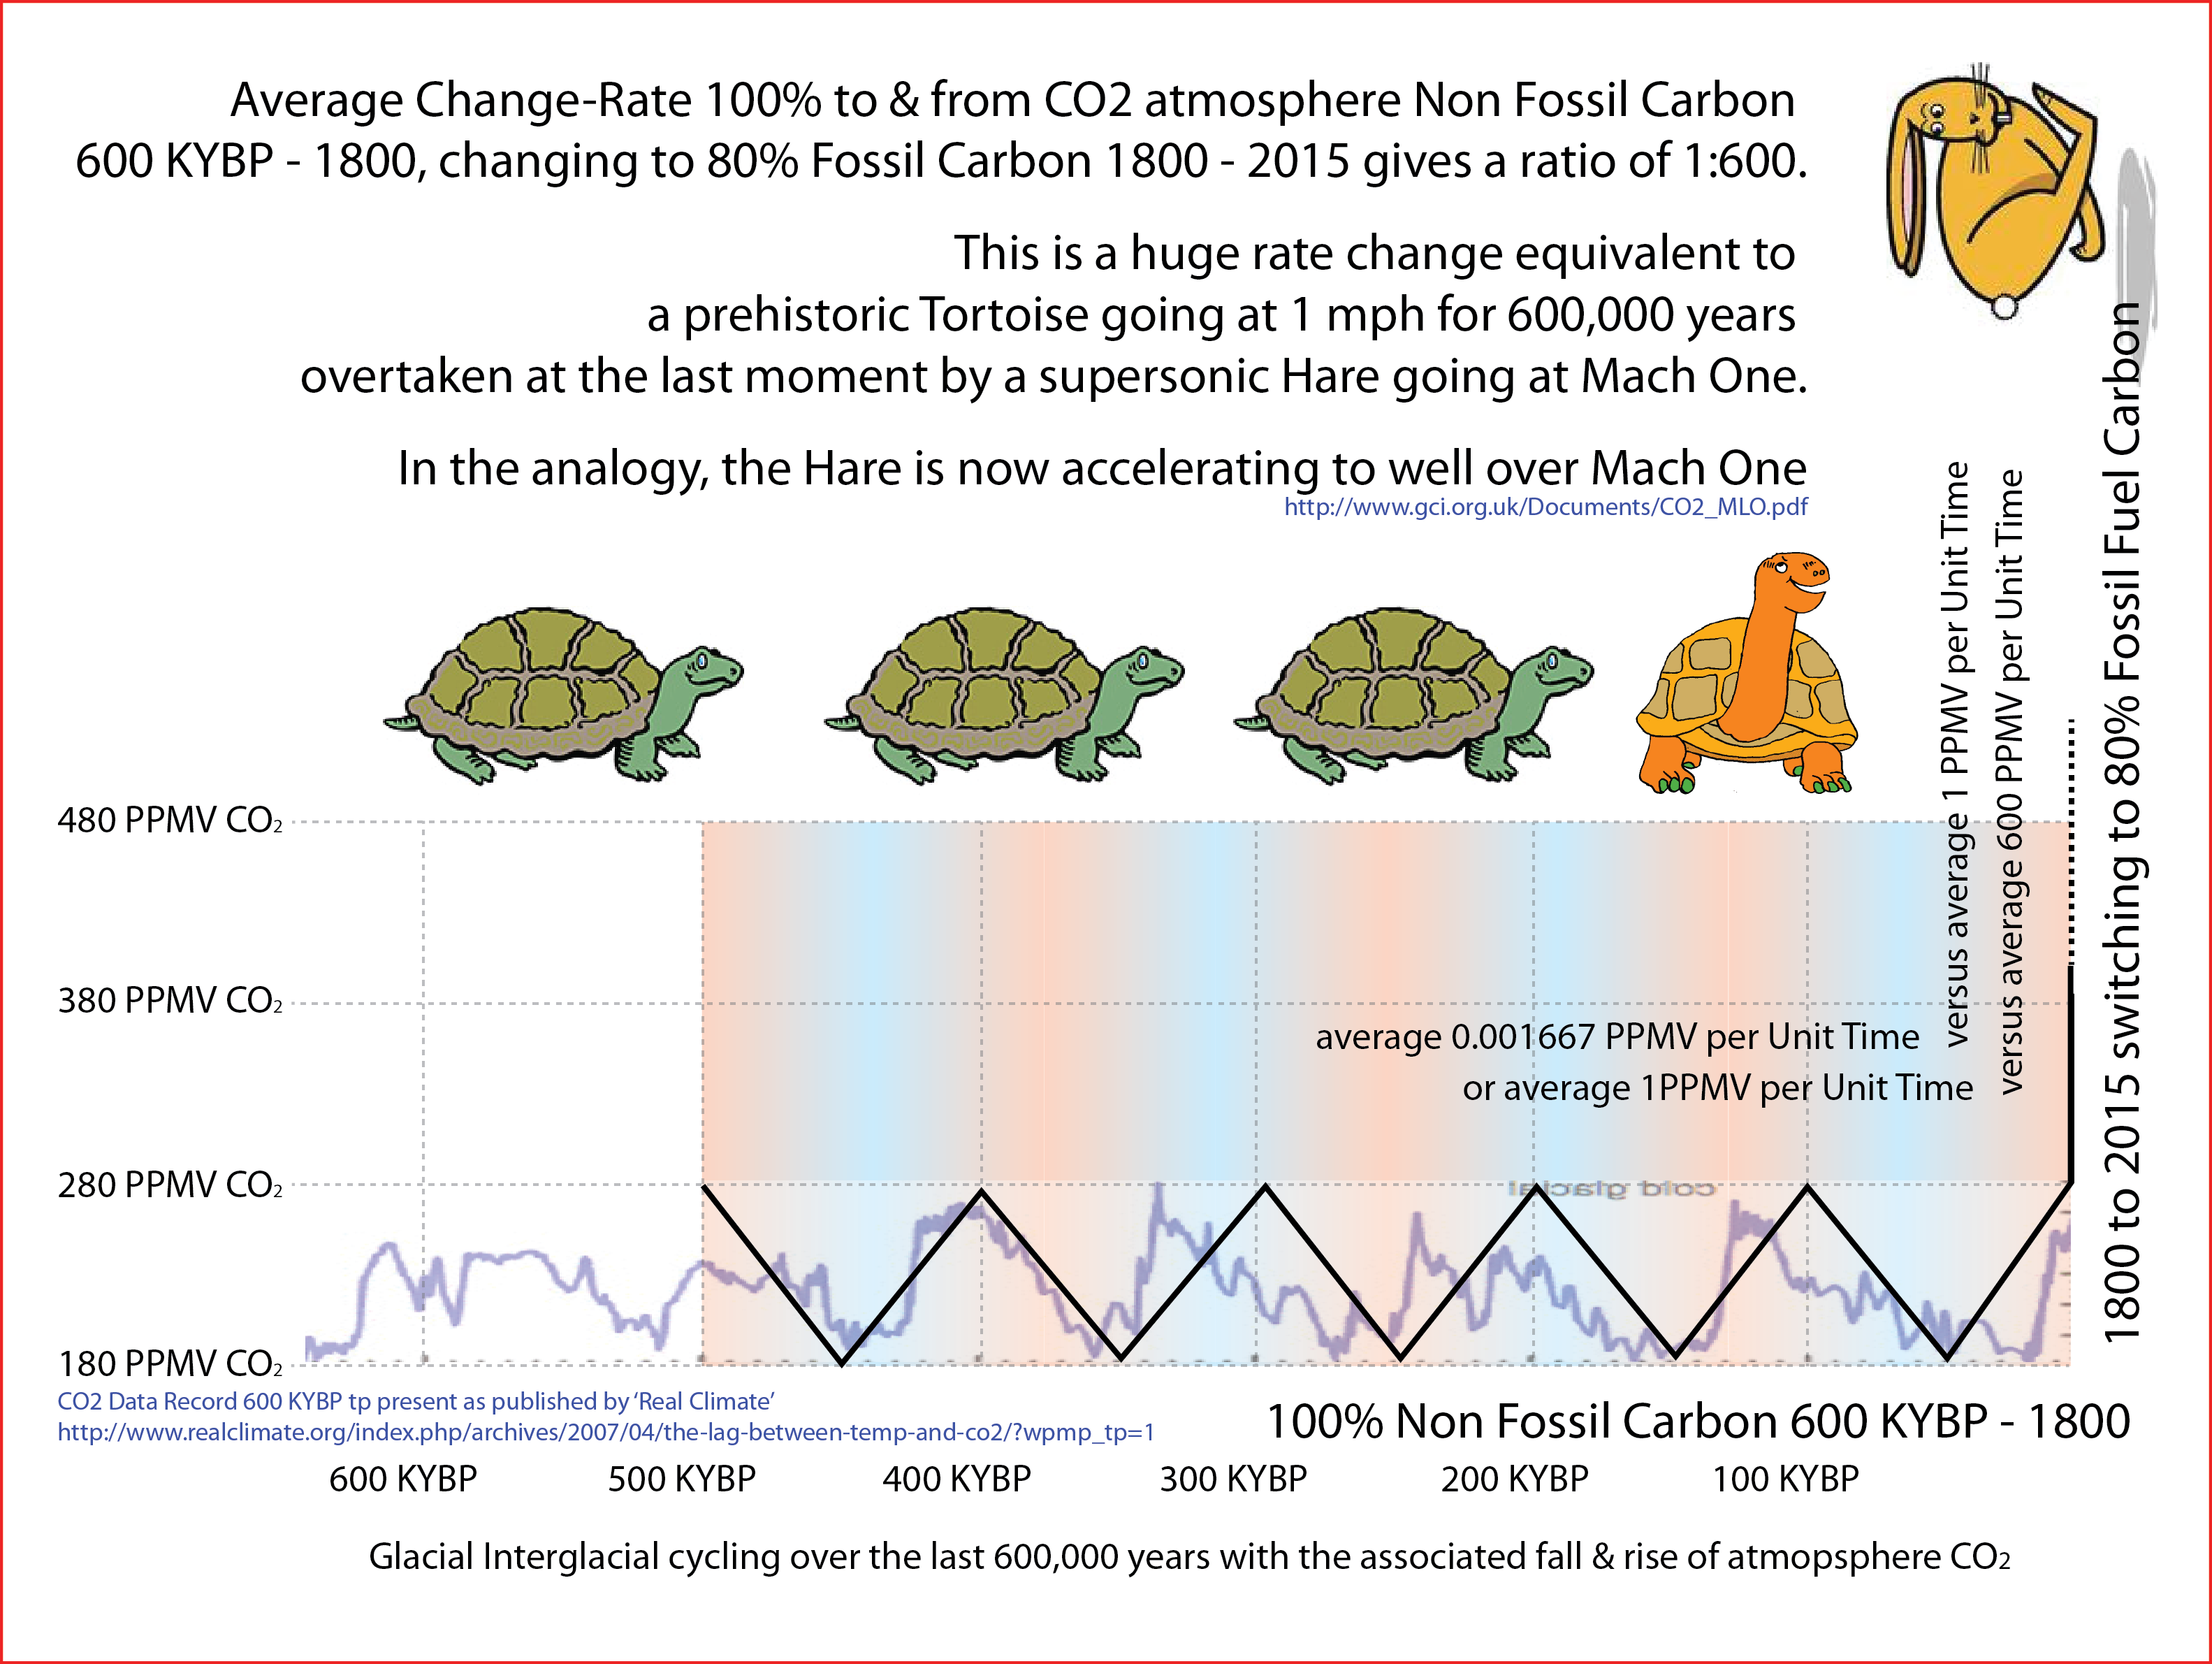
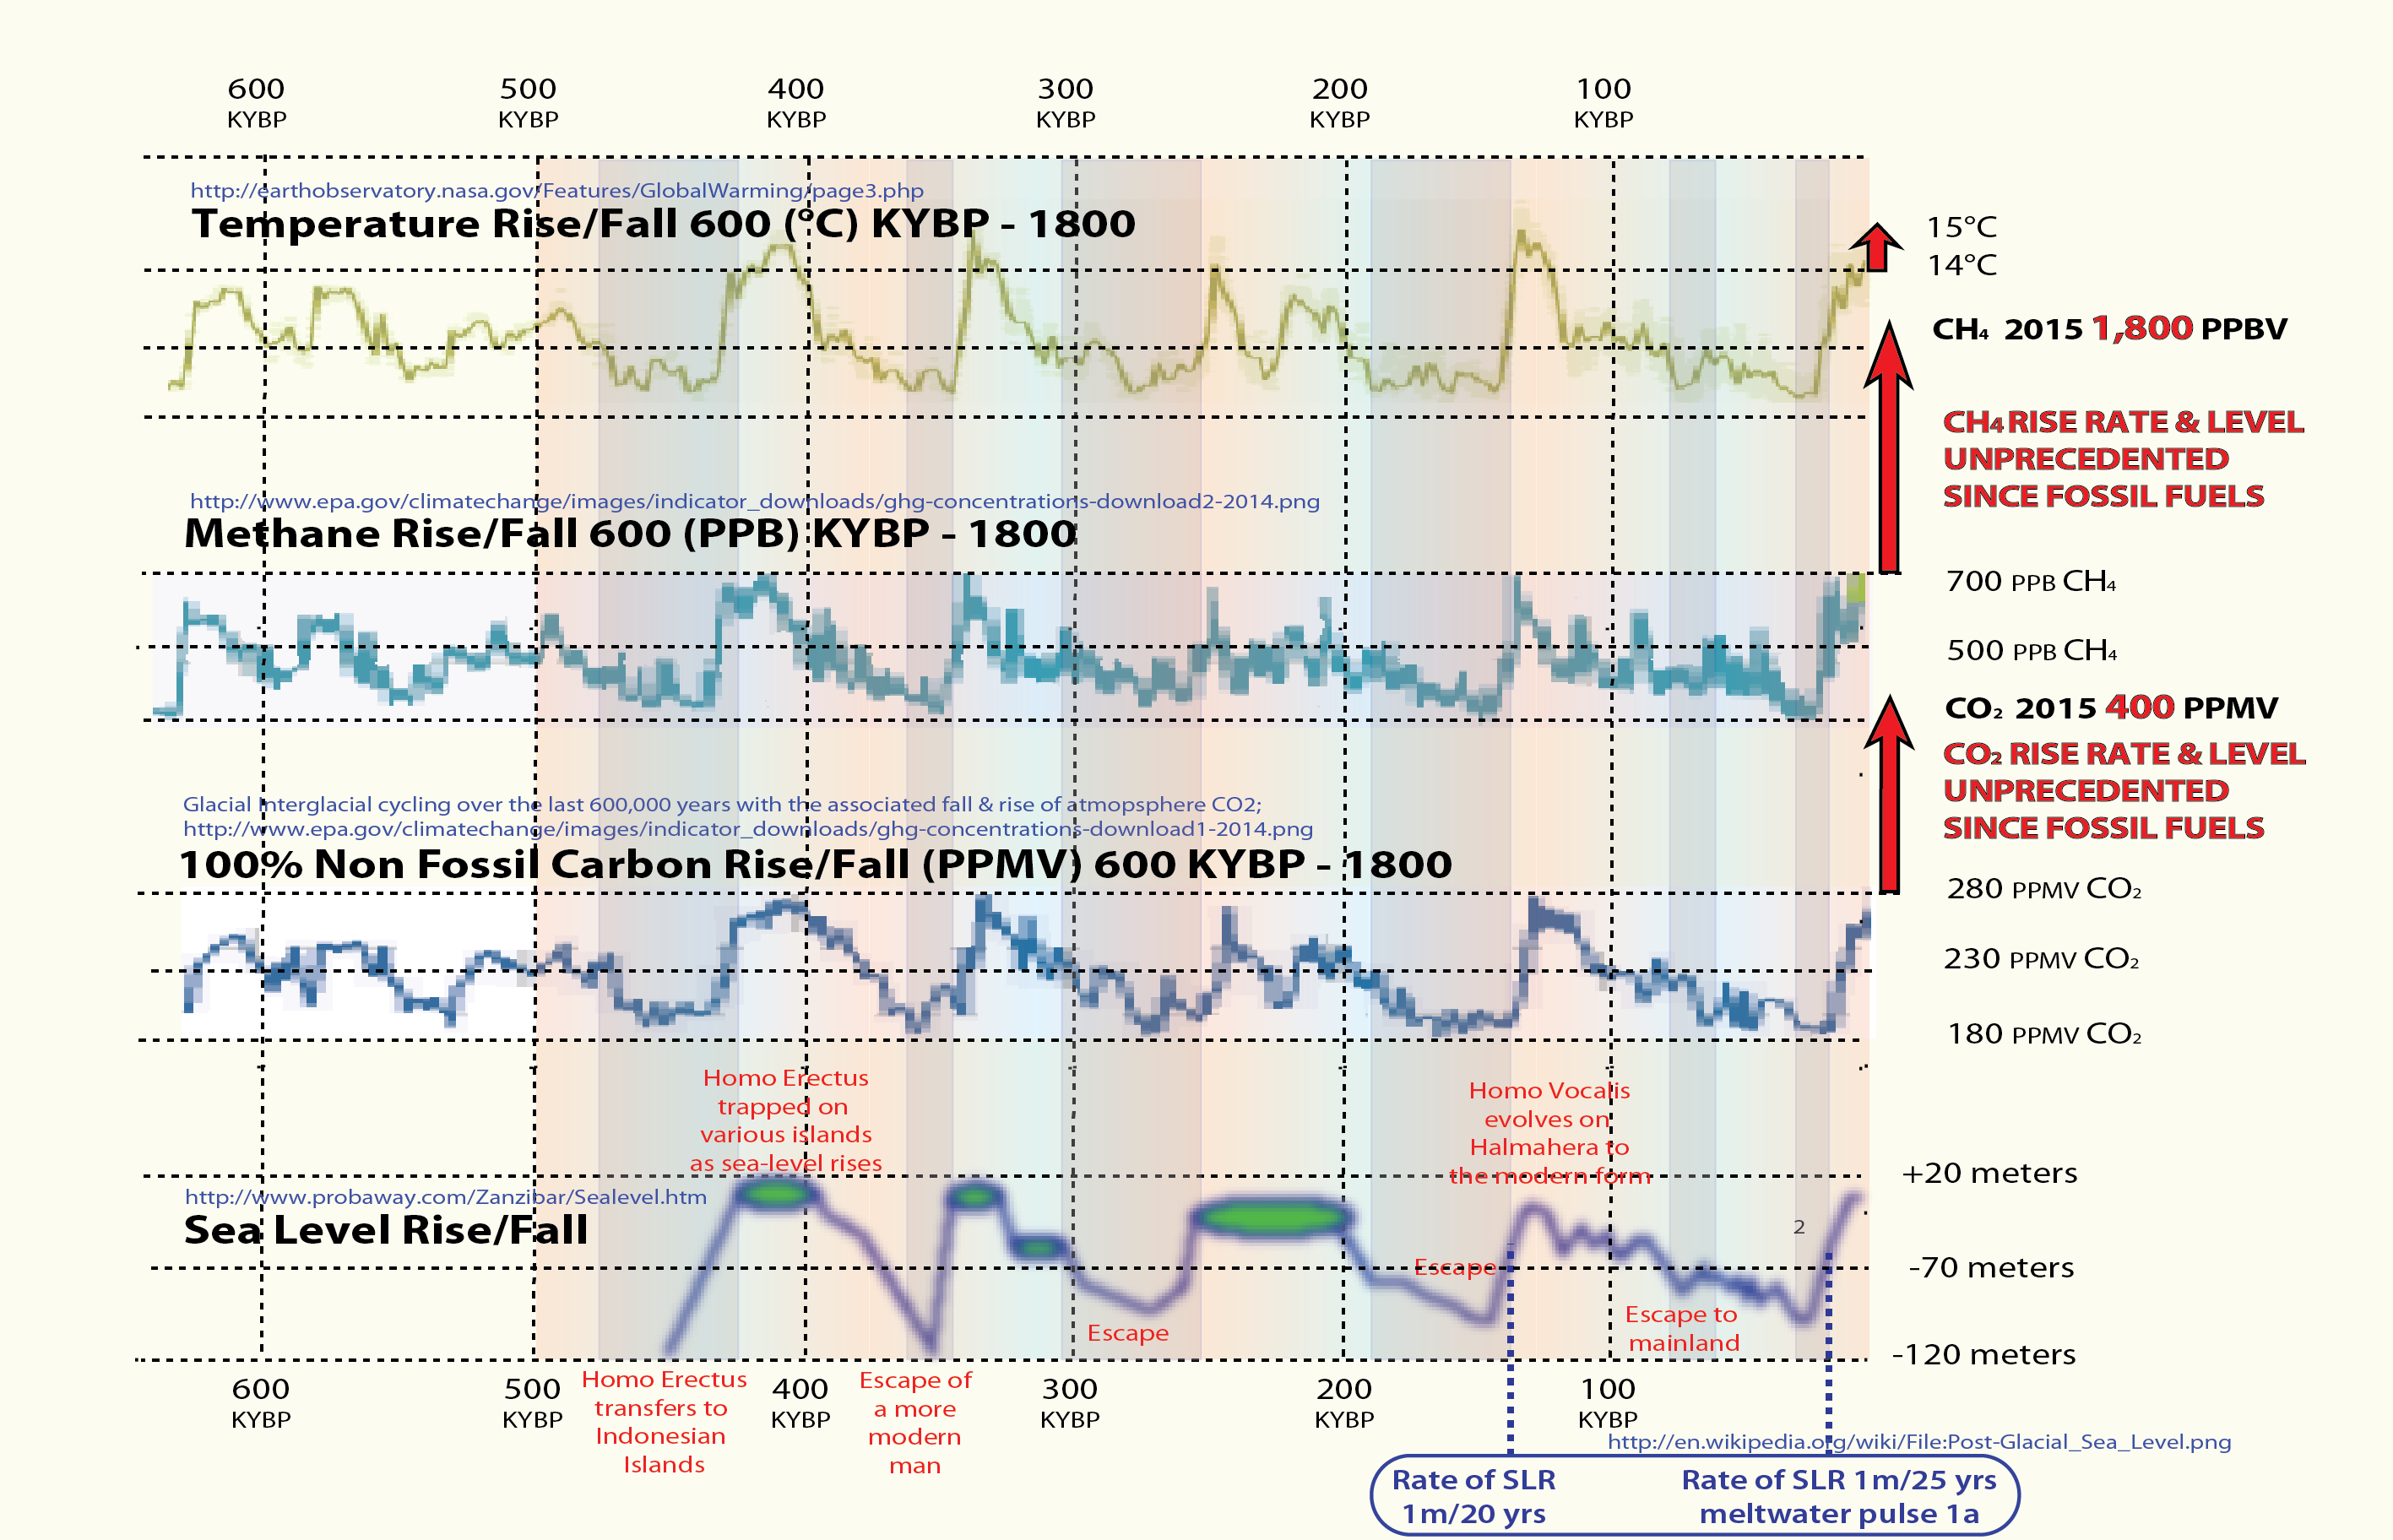
Over the past 600,000 years, non-human greenhouse gas (GHG) emissions, temperature, ocean level and acidity have risen and fallen with a correllation that is clear.
Human GHG emissions since 1800 have fundamentally changed that and the rate at which these have been rising since industrialisation is without precedent.
Future
human greenhouse gas emissions are linked to compliance with the objective of the UN Framework Convention on Climate Change (UNFCCC) Objective as 'Carbon Budgets' or 'Carbon-Contraction-Events'. Since human-induced rates of Climate Change are now an existential threat, this objective is contracting future Greenhouse Gas (GHG) emissions
from human sources, fast enough to achieve safe, stable & sustainable future
atmospheric
GHG concentration.
Strategically aimed at UNFCCC-Compliance, the Carbon Budget Accounting Tool (CBAT) sizes and measures future 'Carbon Budgets' and associated change-rates as
'path-integrals' arising across the '4 domains' of CBAT (see above and below).
- CBAT is a 'user-as-chooser' device. Within its science-based structure, users have inter-dependent options for sizing carbon-budgets & their potential consequences.
- Quantifying the stock:flow dynamic (see below) between emissions-budgets & concentrations needed for compliance with that UNFCCC Objective is central to CBAT.
- As a user-inter-active animation, CBAT enables
users to make emission-budget-choices governing future climate, that do or don't result in achieving that UNFCCC objective.
- The sequence in CBAT is through '4 domains' (see below) where the key user-control parameter is the 'choice-shaping/sizing' of future Carbon Budgets in Domain 1.
- The carbon-budget calculations for UNFCCC-Compliance are measured in tonnes of carbon and
govern all the rate-change-issues arising in Domains 2, 3 & 4 . . . . (see below)
- The Carbon Budget setting chosen in Domain One can be re-set in any of the other three Domains, which resets the budget in all other Domains to the budget chosen.
- Essentially this means that for CBAT to make any policy-relevant sense, the 4 Domains are four different views of *the same weight and rate of the carbon contraction-event*.
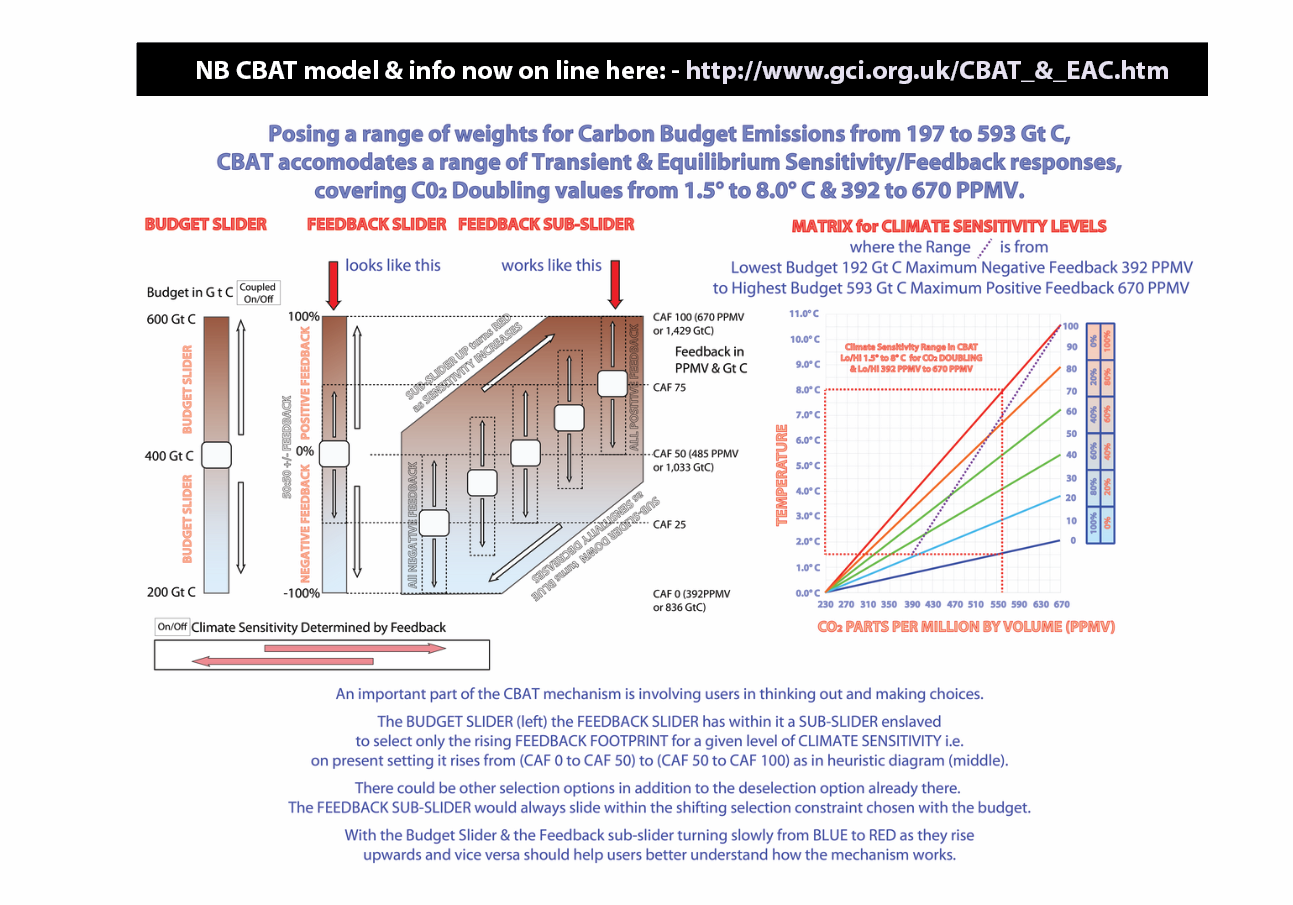
- CBAT also goes from the mathematical logic of the 'knowns' to logically & scientifically defensible parametric arrays covering the 'unknowns' of feedbacks & climate-sensitivity.
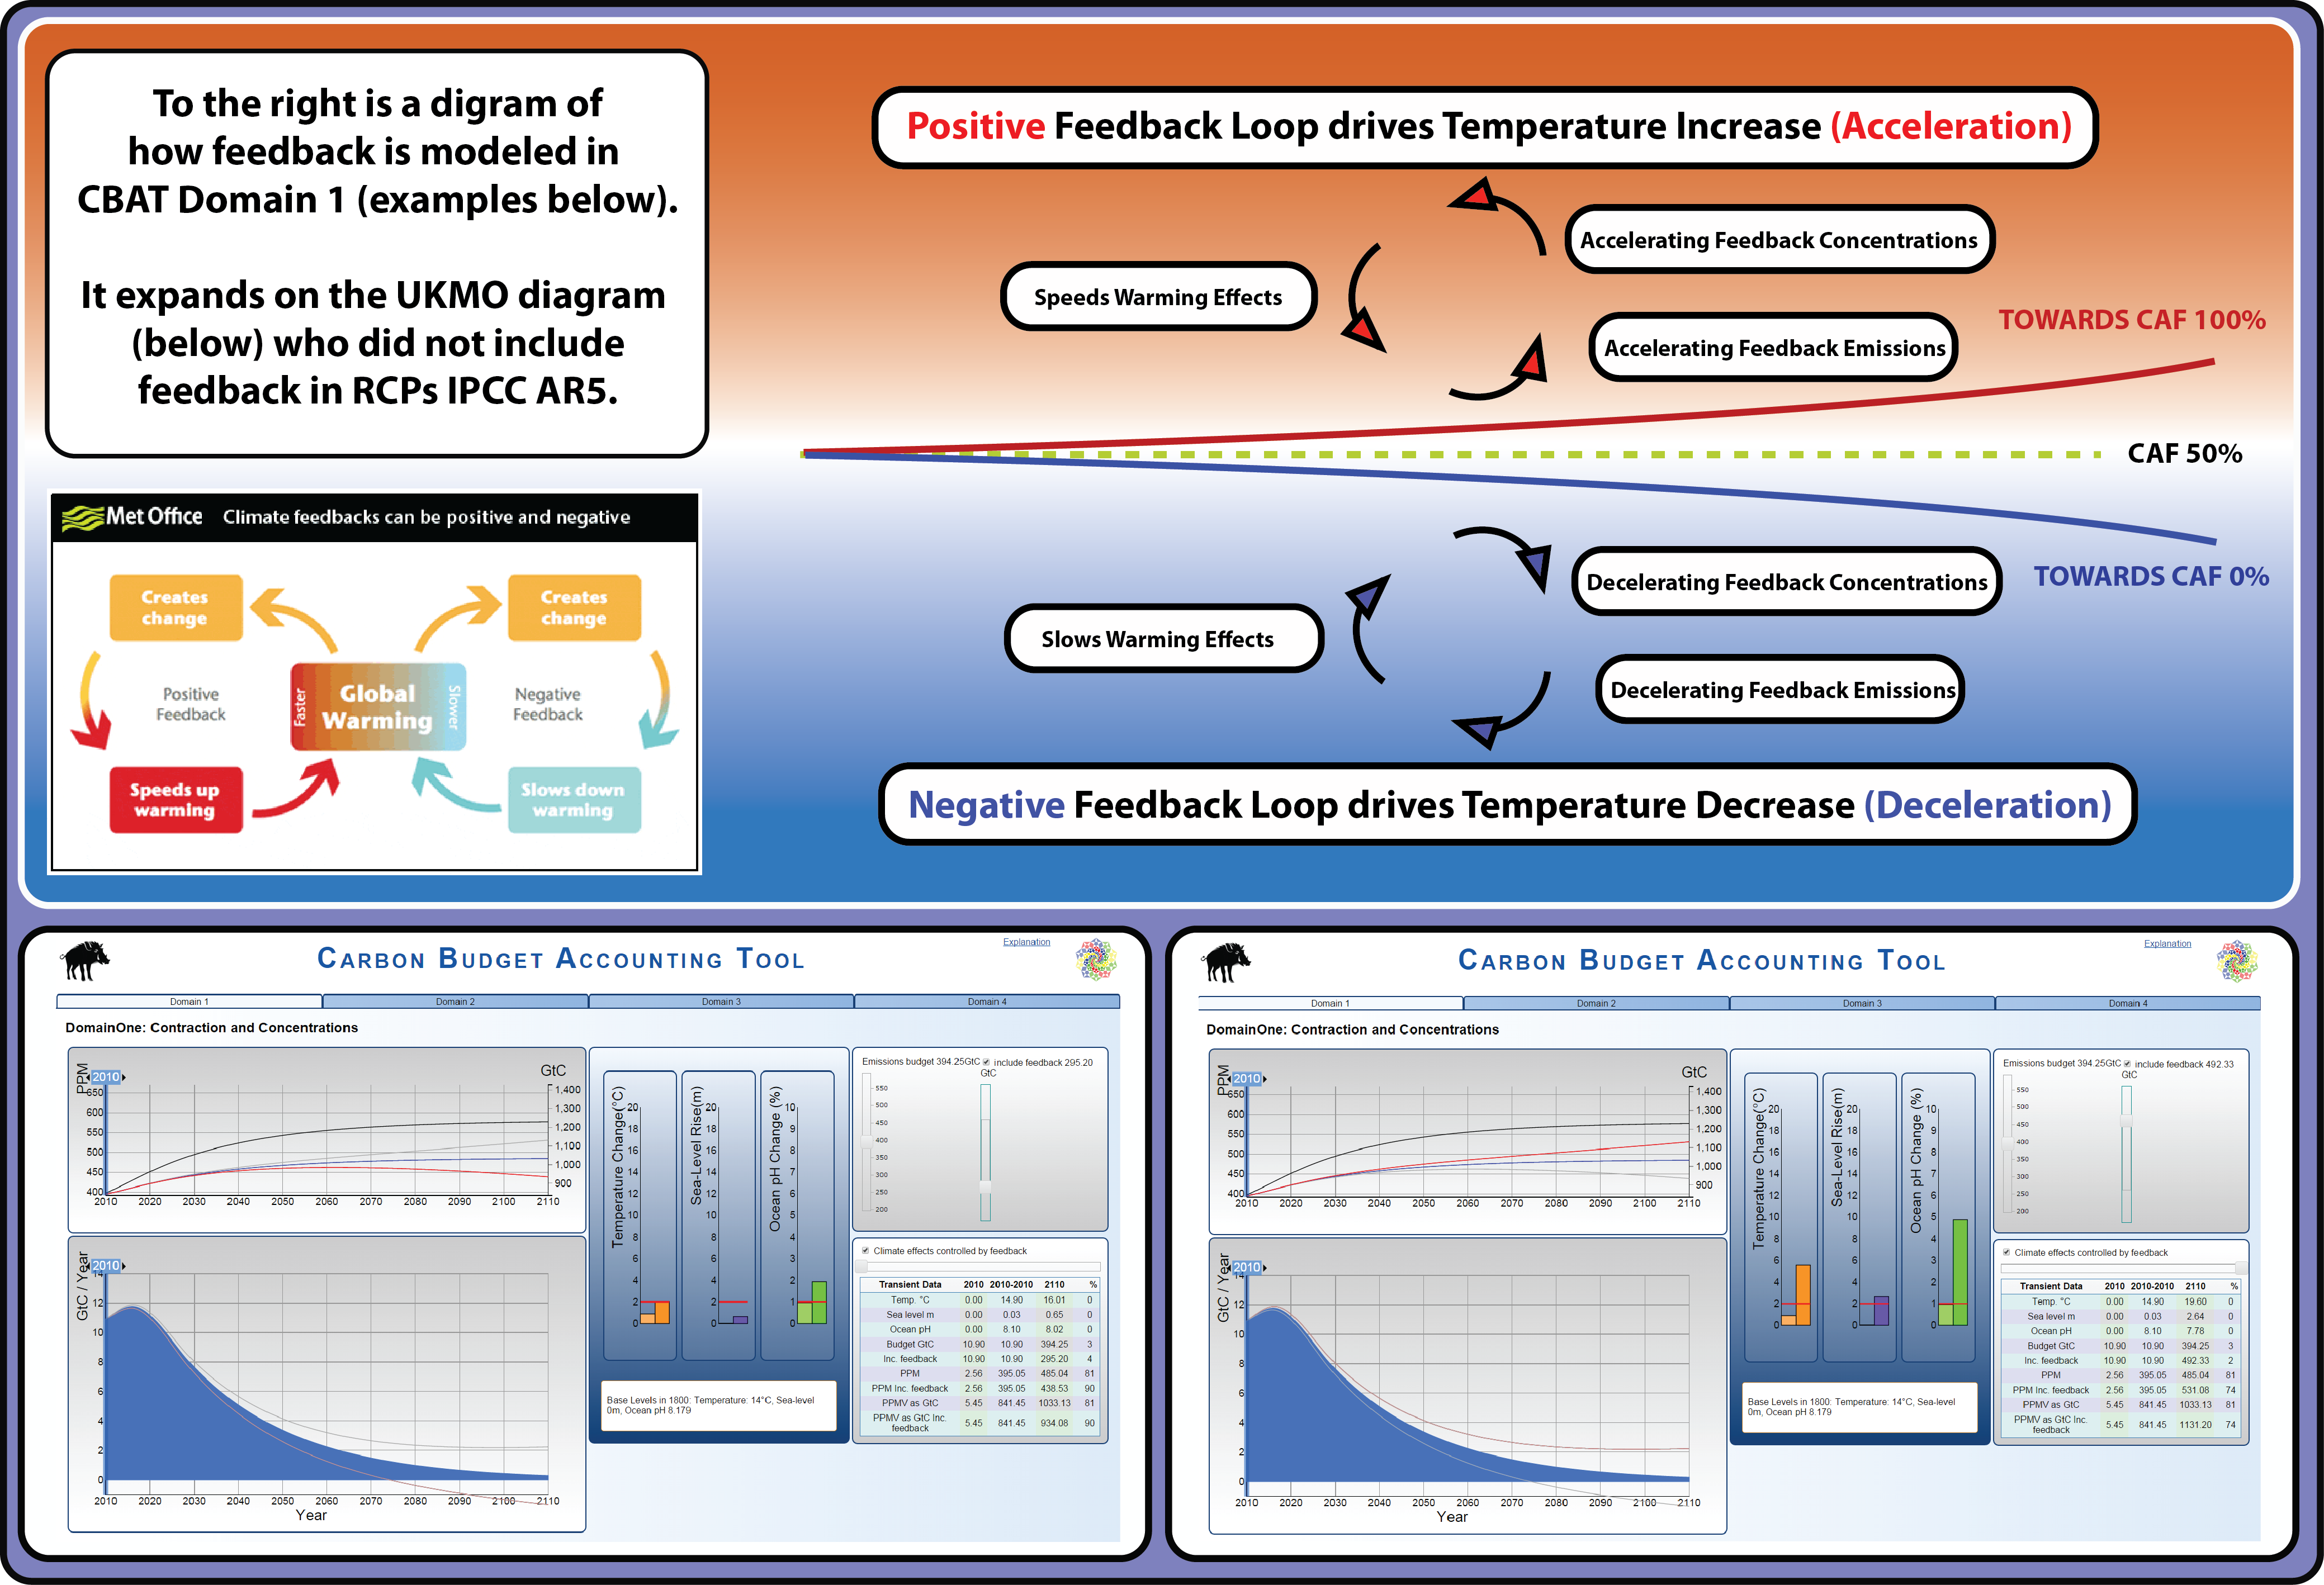
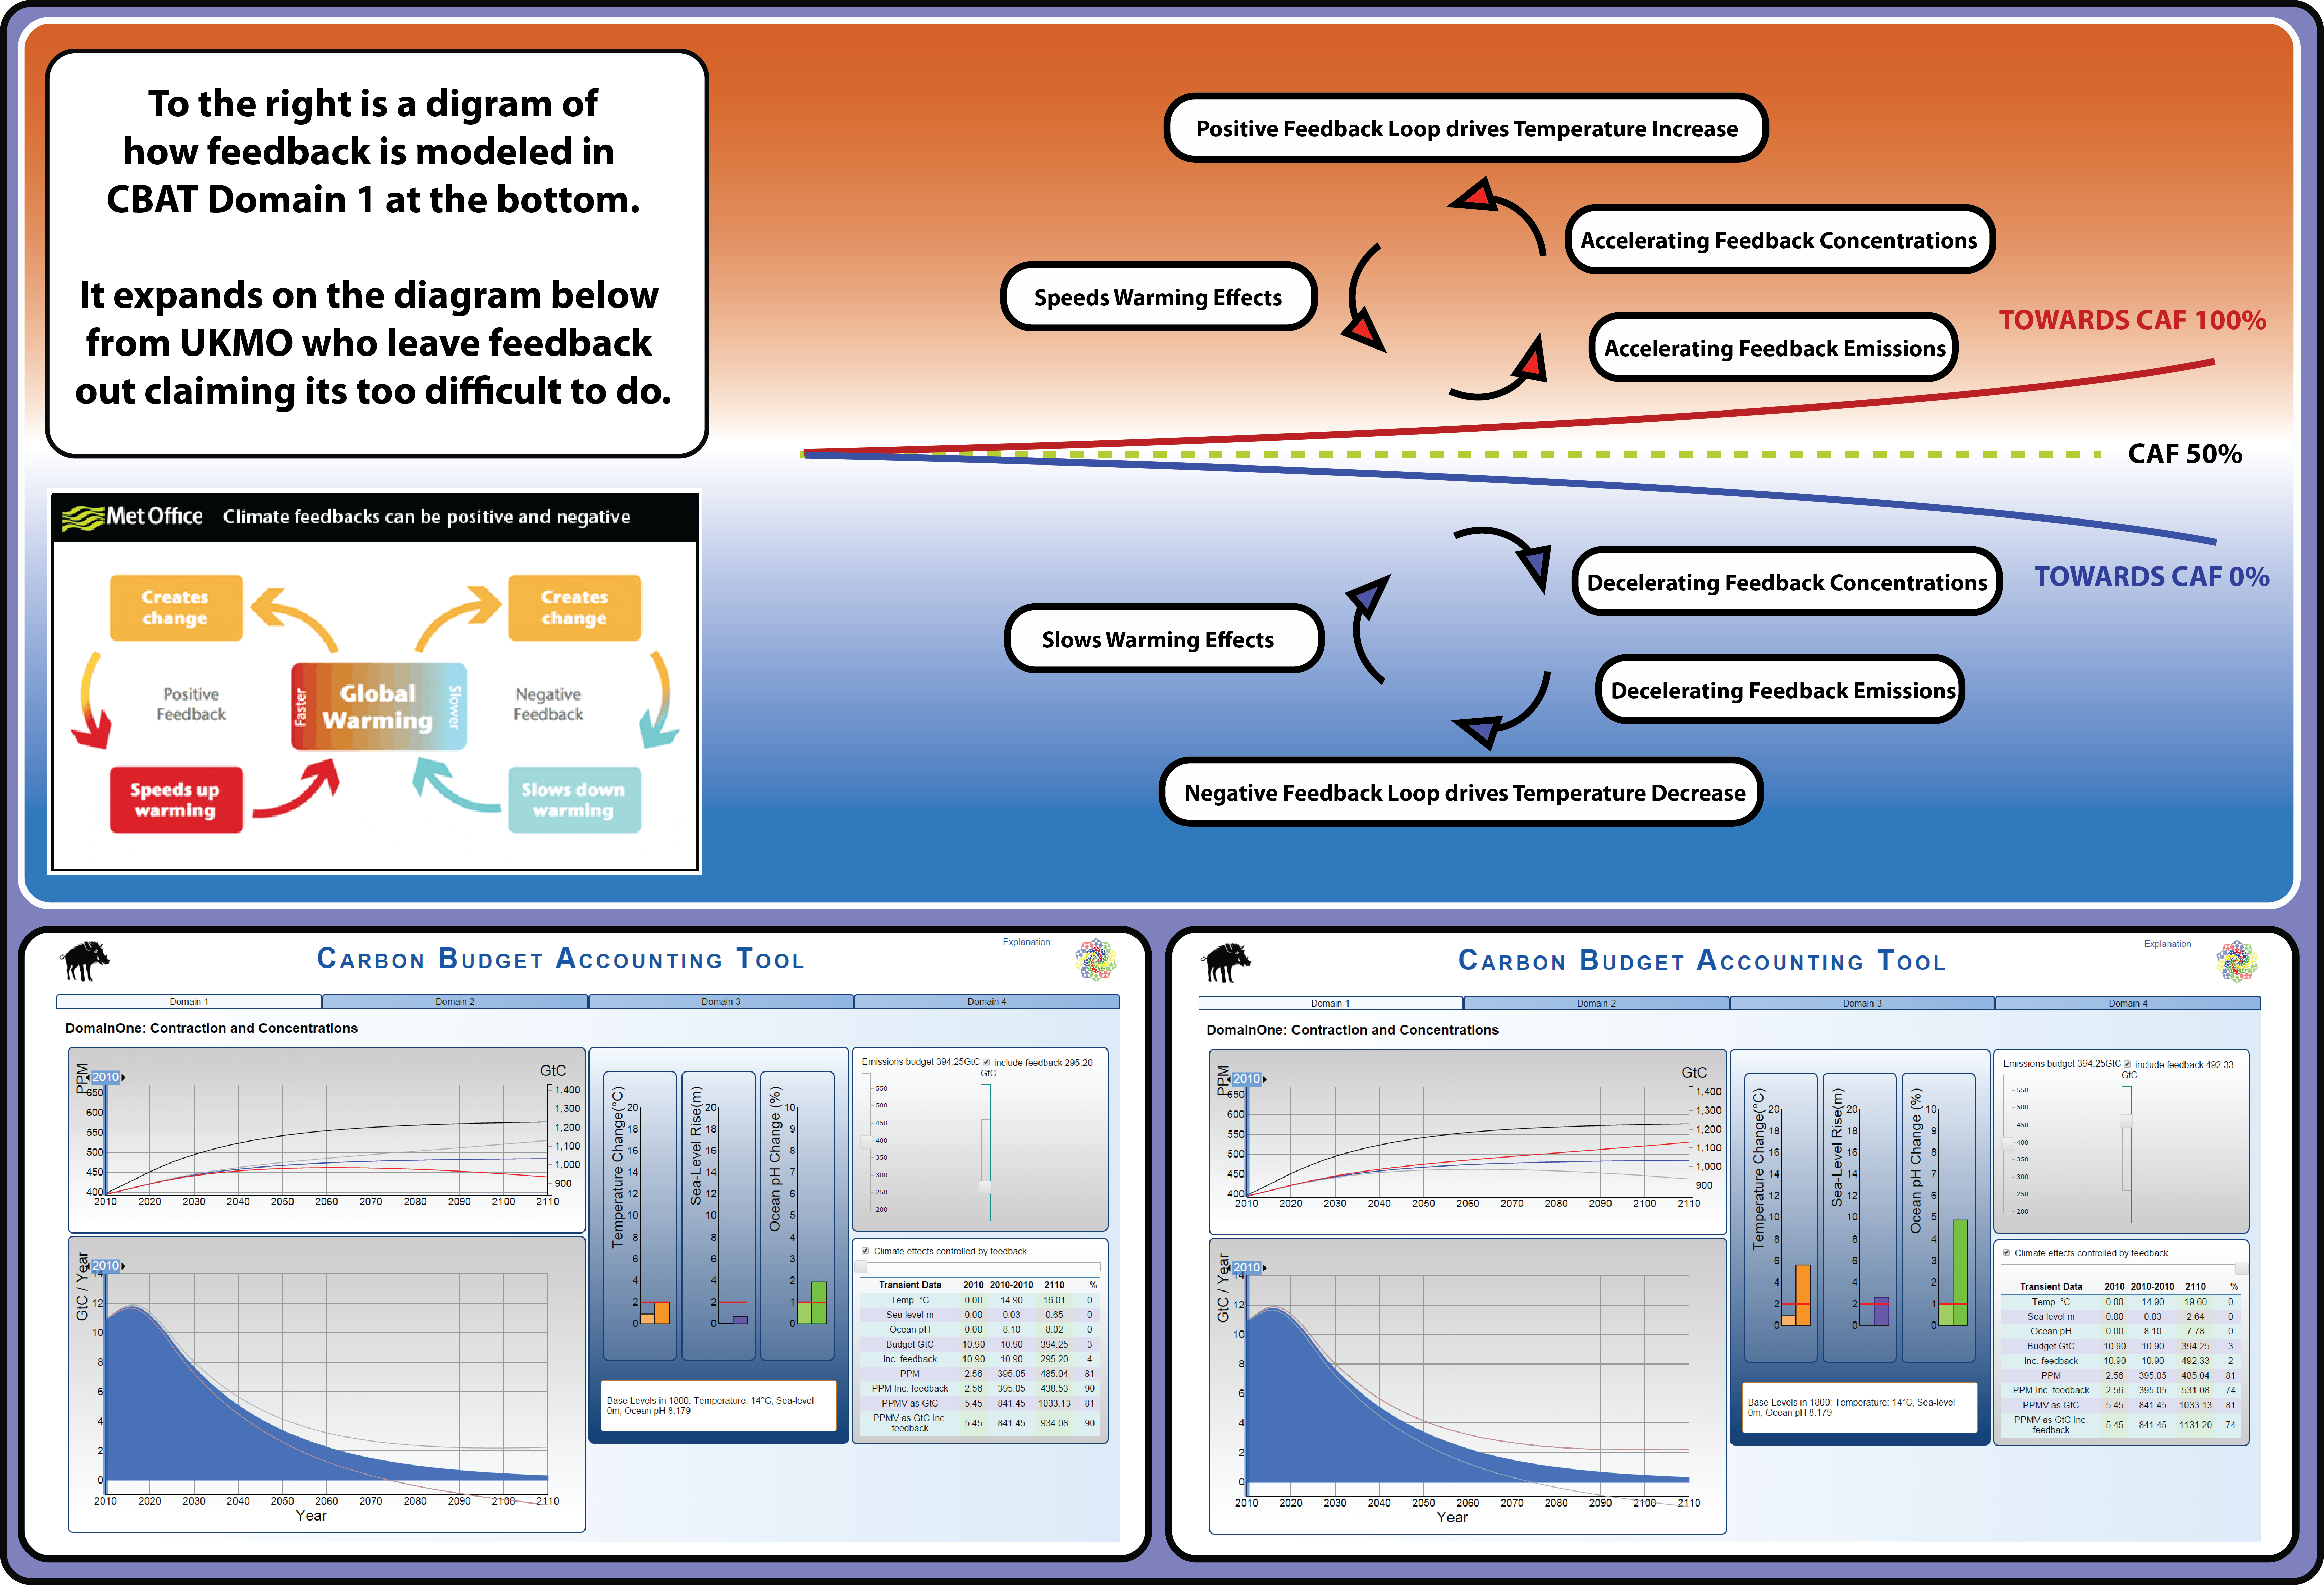
- System potential for +/- feedback has accumulation above CAF 50% (see in D1 below) as positive (acceleration) and accumulation below as negative (deceleration).
- To keep negative, a goal focus of achieving 100% renewables = 0% carbon by 2050, means laissez-faire 'evolution' is replaced by a goal-focused strategy of 'evolition'.
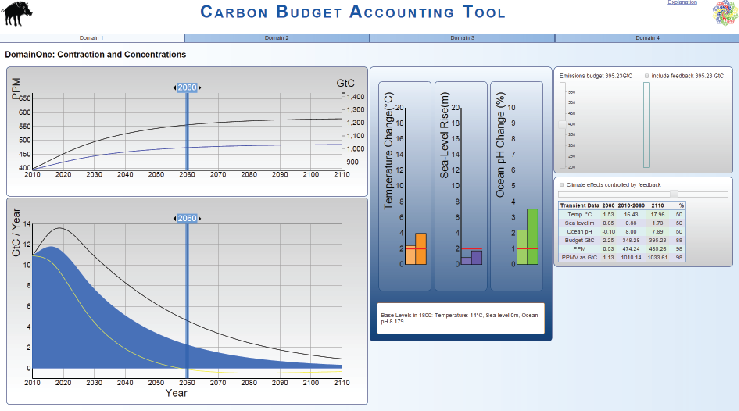
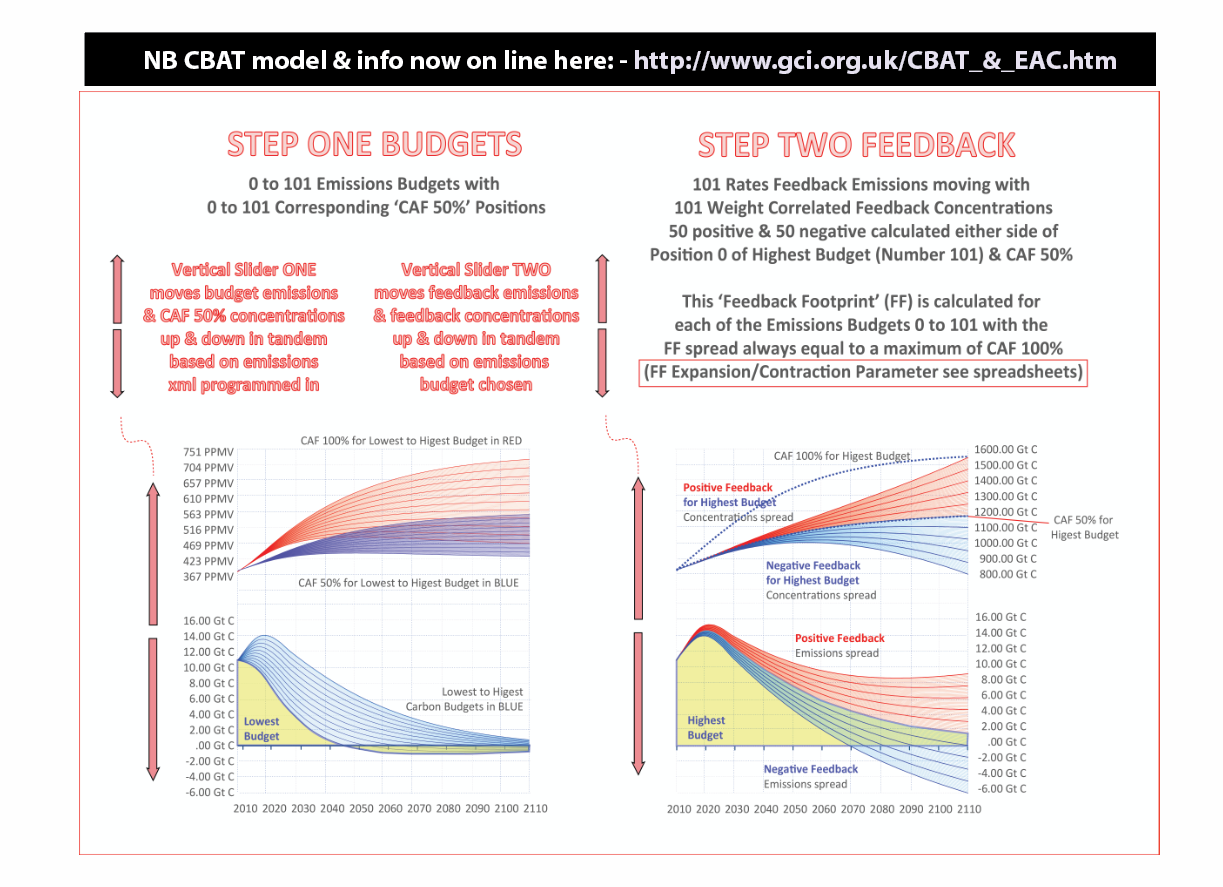
DOMAIN ONE (D1) - Contraction & Concentrations (C&C1) - Budget-emissions separate from feedback-emissions/effects and accumulations in the atmosphere.
Domain One shows a range of 'Global Carbon Budgets' (or carbon- contraction- events). This is the calculating basis of all 4 CBAT Domains.
With numerical sliders this basis quantifies & shows visually in dynamic graphics & tables,
credible ranges of possible future trend-relationships (2010-2110) between: -
- Various Integral Values for 'Global Carbon Budgets' - these
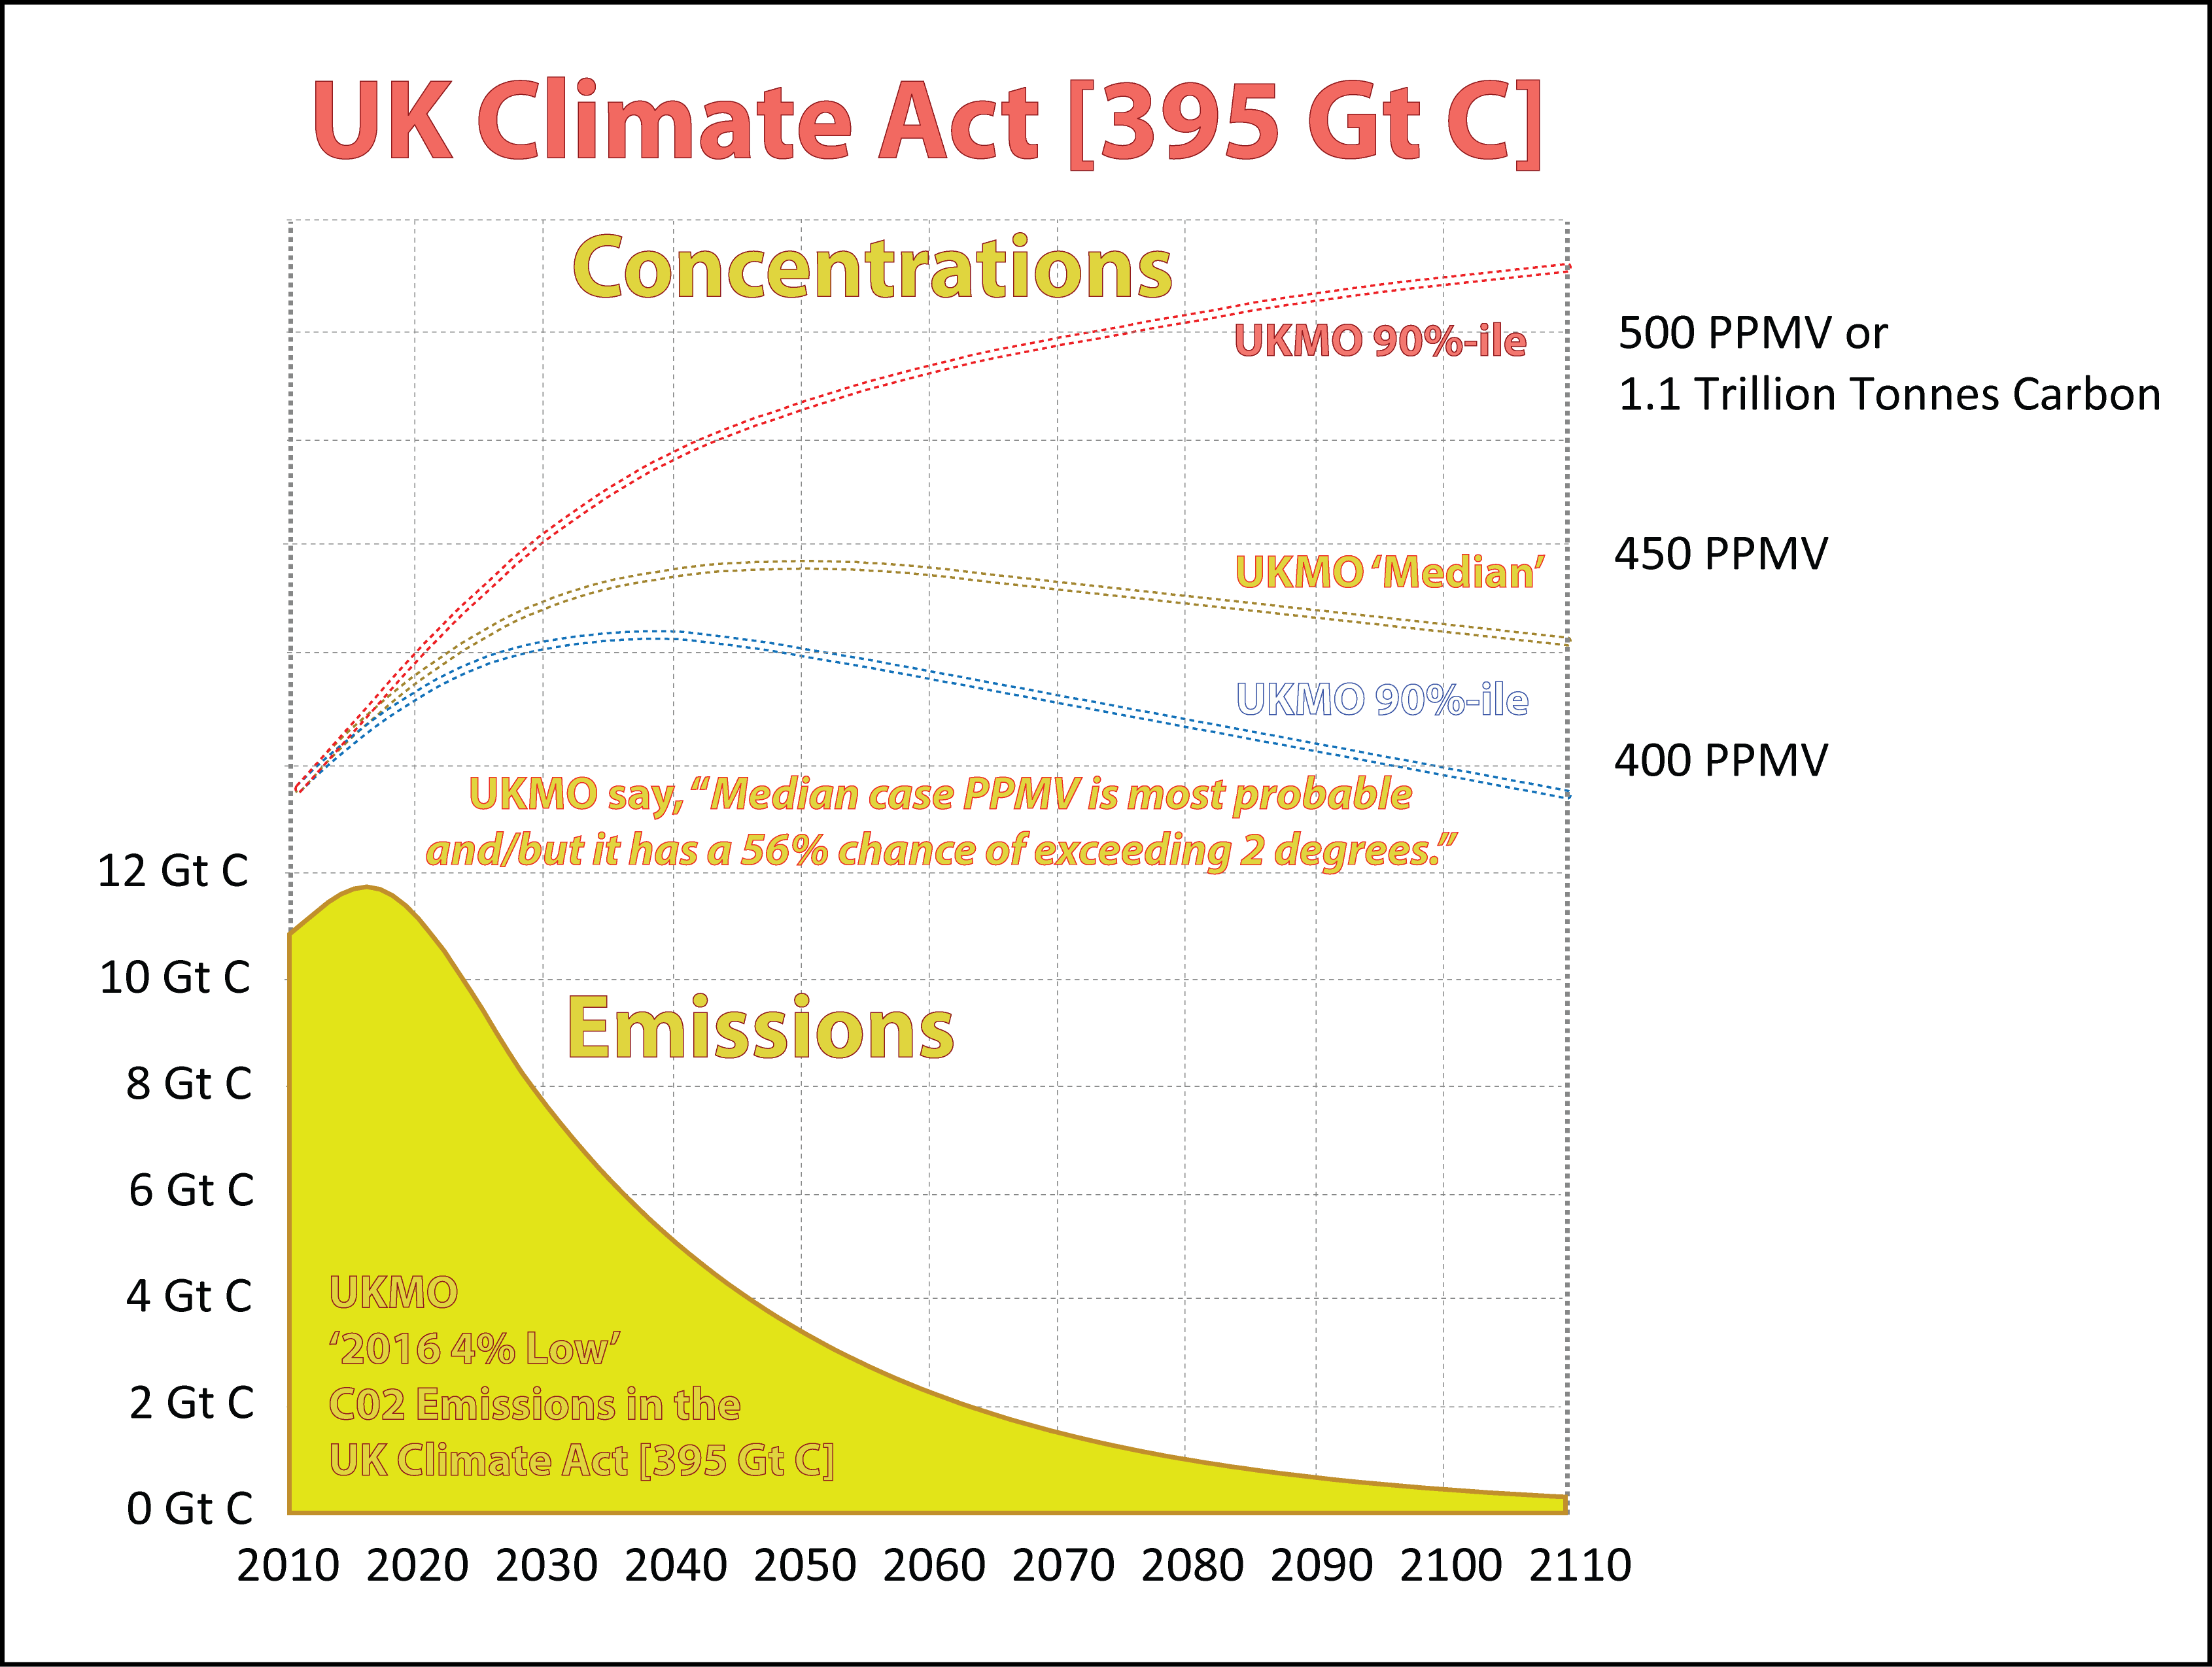
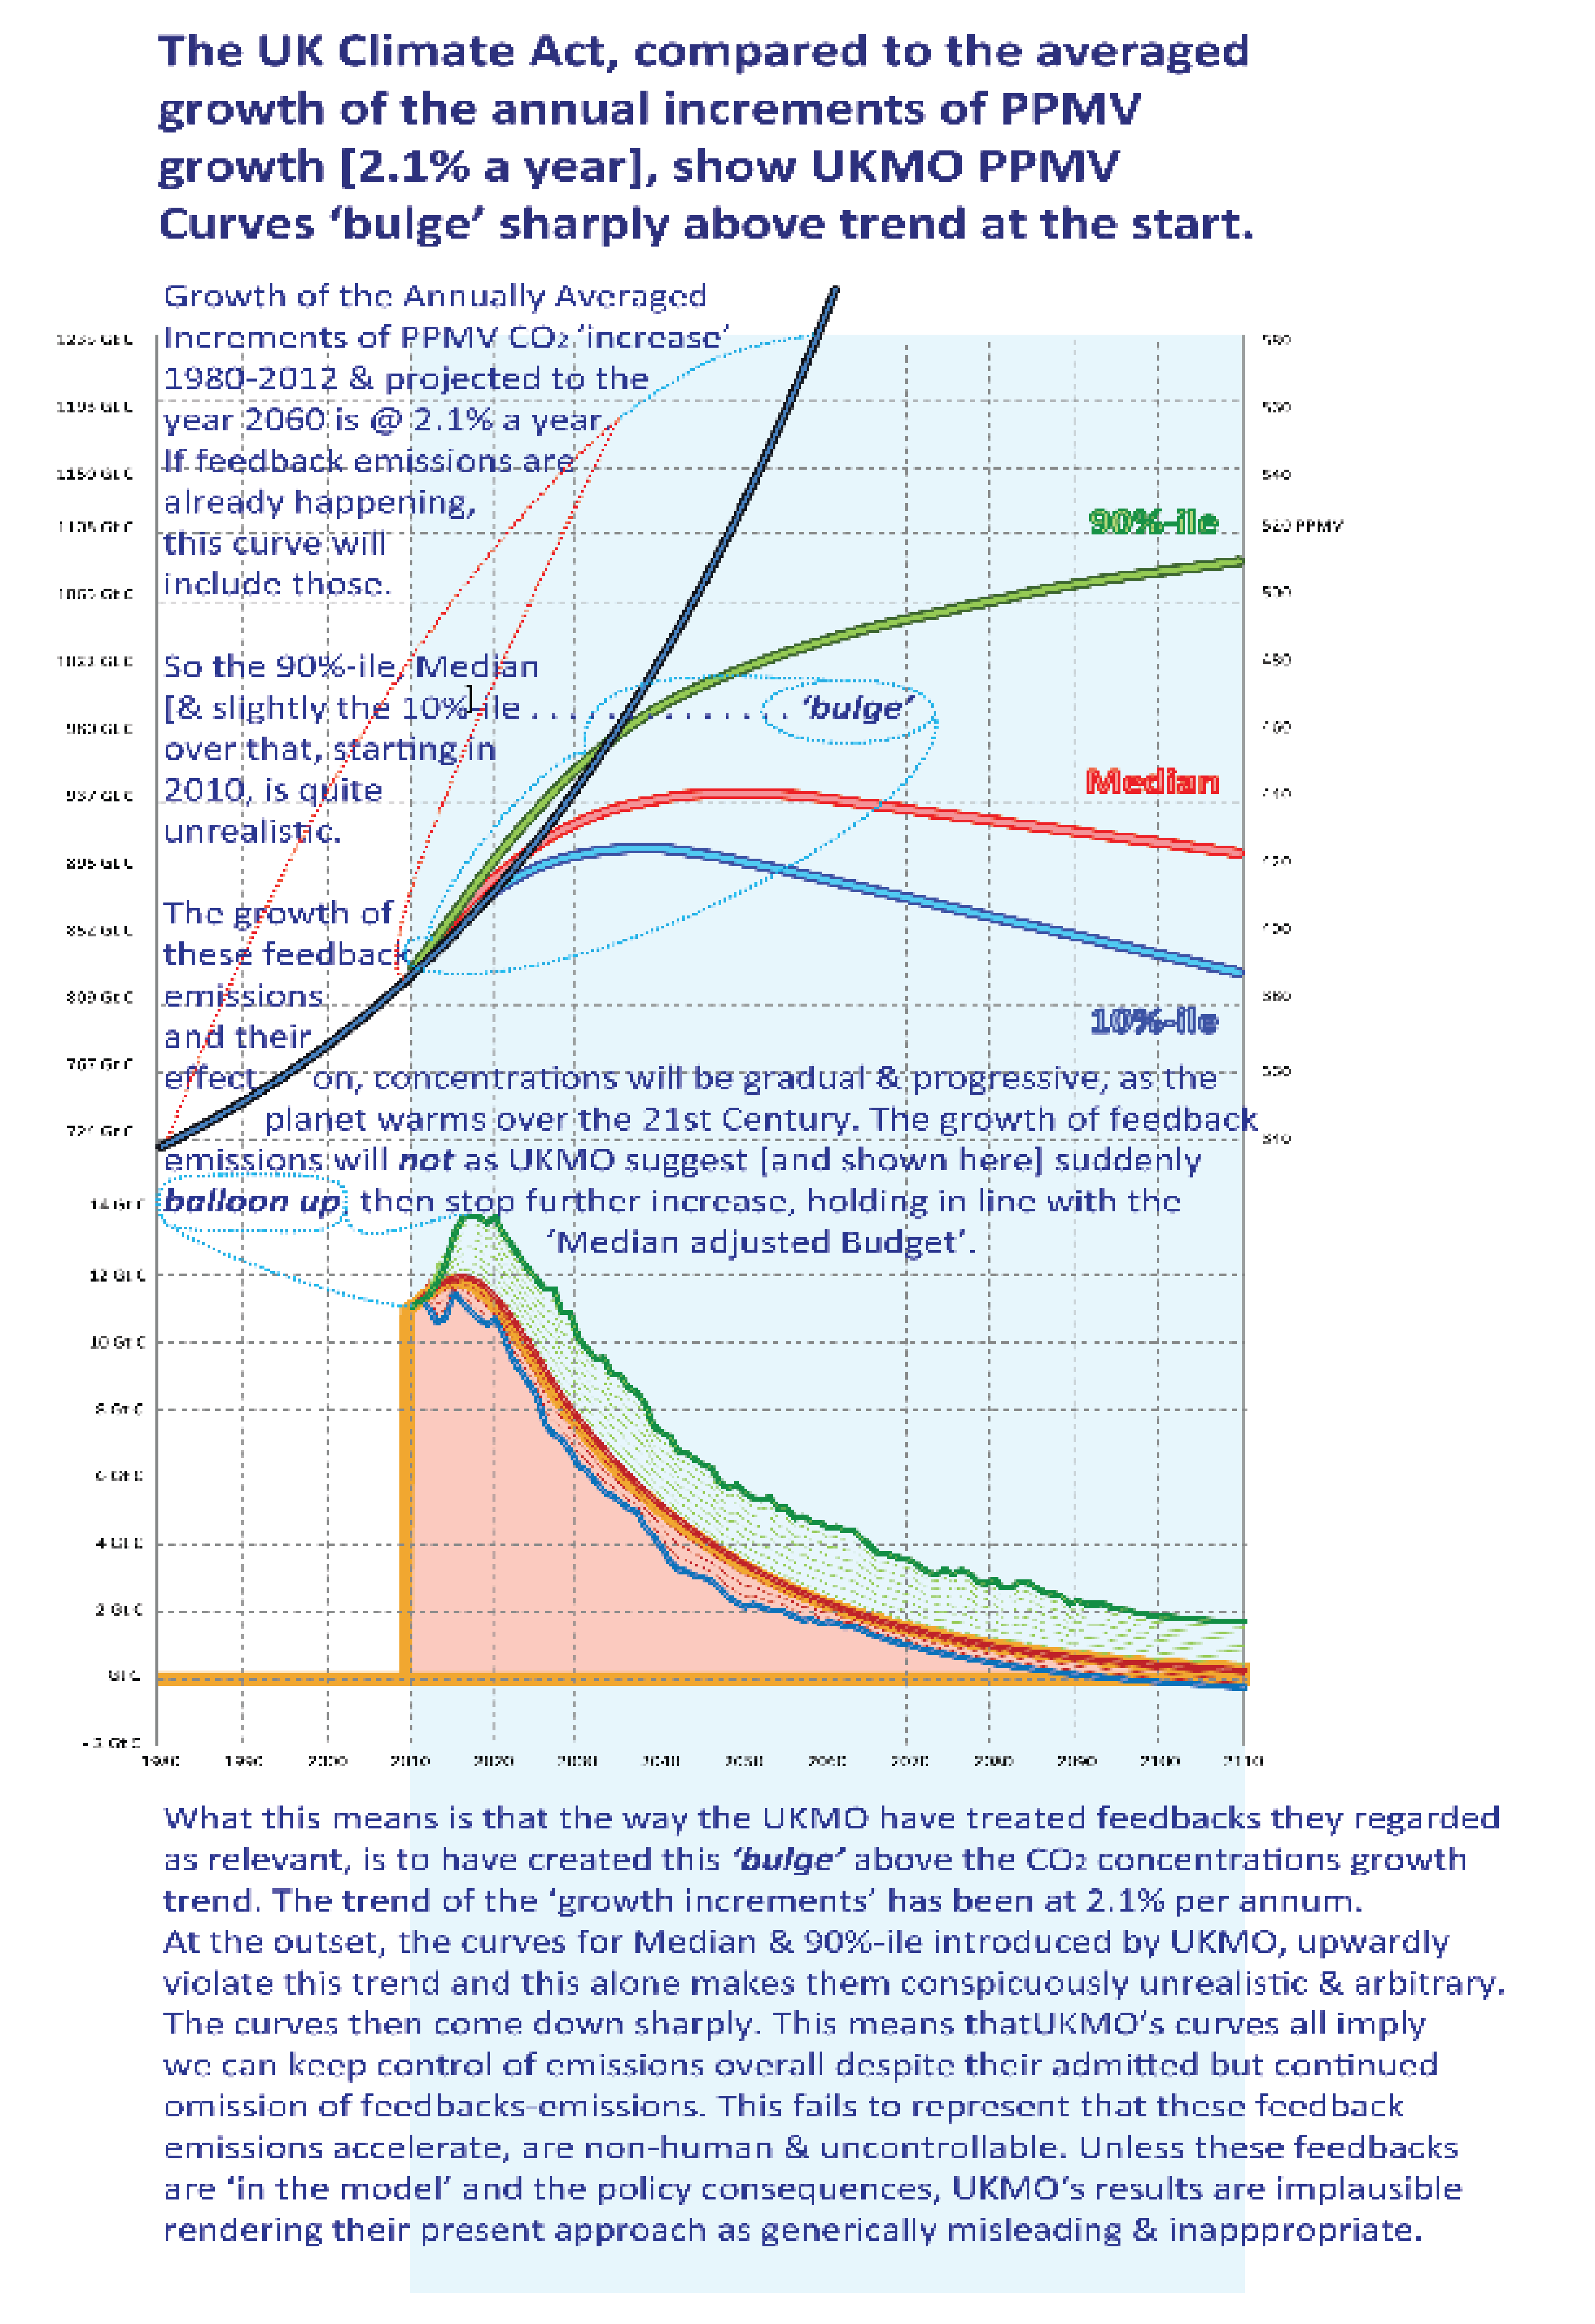
are projections of future 'human-source emissions as global carbon 'path-integrals' of weights/rates/dates or future 'carbon-contraction-events'. First vertical slider, central default Carbon Budget of 395 Gt C (2010-2110), *is the Global Carbon-Budget, as in the UK Climate Act*
- Where these 'budget-emissions' are separated from Feedback-Emissions, a second slider offers user-choice in arrays of different possible rates of inter-active feedback emissions and effects (IAFEE). These are trend-curves that sum the IAFFE as CO2 equivalent. These are certain though the mix, scale & to a limited extent
the sign (+/-) are not.
- These are covered
with slider-choice ranging between either net positive (acceleration) or net-negative (deceleration) of emissions above or below the budget-emissions chosen with the budget-slider & where both budget-emission & feedback-emission from slider-choices recombine as consequential global Atmospheric CO2 Concentration outcomes.
- These are measured, dynamically tabulated and shown as atmospheric concentrations in both PPMV & Gt C (where 1 PPMV CO2 = 2.13 Gt C)
- expressed within a framework of CAF 0%, CAF 50% & CAF 100%
- Where CAF='Constant Airborne Fraction' of the Carbon-Budget chosen, accumulating as 'atmospheric concentrations'
- as a frame of reference where CAF 50 (50% of the budget) is the Blue Line; CAF 100 (100% of the budget) is the Grey Line shown
- In CBAT concentrations accelerating above CAF 50% reflecting feedback potential that is 'positive'
- In CBAT concentrations decelerating below CAF 50% reflecting feedback potential that is 'negative'
- The historic average of CAF is disputed a little between 45 & 50%.
- How this relationship evolves in future is considerably disputed, as with the UK Climate Act here and here for example.
- Here, estimates of the future Airborne Fraction vary significantly depending on whether feedbacks are included in or are excluded from the climate models used.
- The climate model behind the UK Climate Act and the climate models behind the RCP scenarios in IPCC AR5 mostly exclude all feedback modeling (further note)
- In CBAT Domain One feedback potentials are included as described above, as not to include these leads to potentially misleading results.
- From a policy perspective, maintaining the distinction between 'budget-emissions' & 'feedback emissions'
is critical.
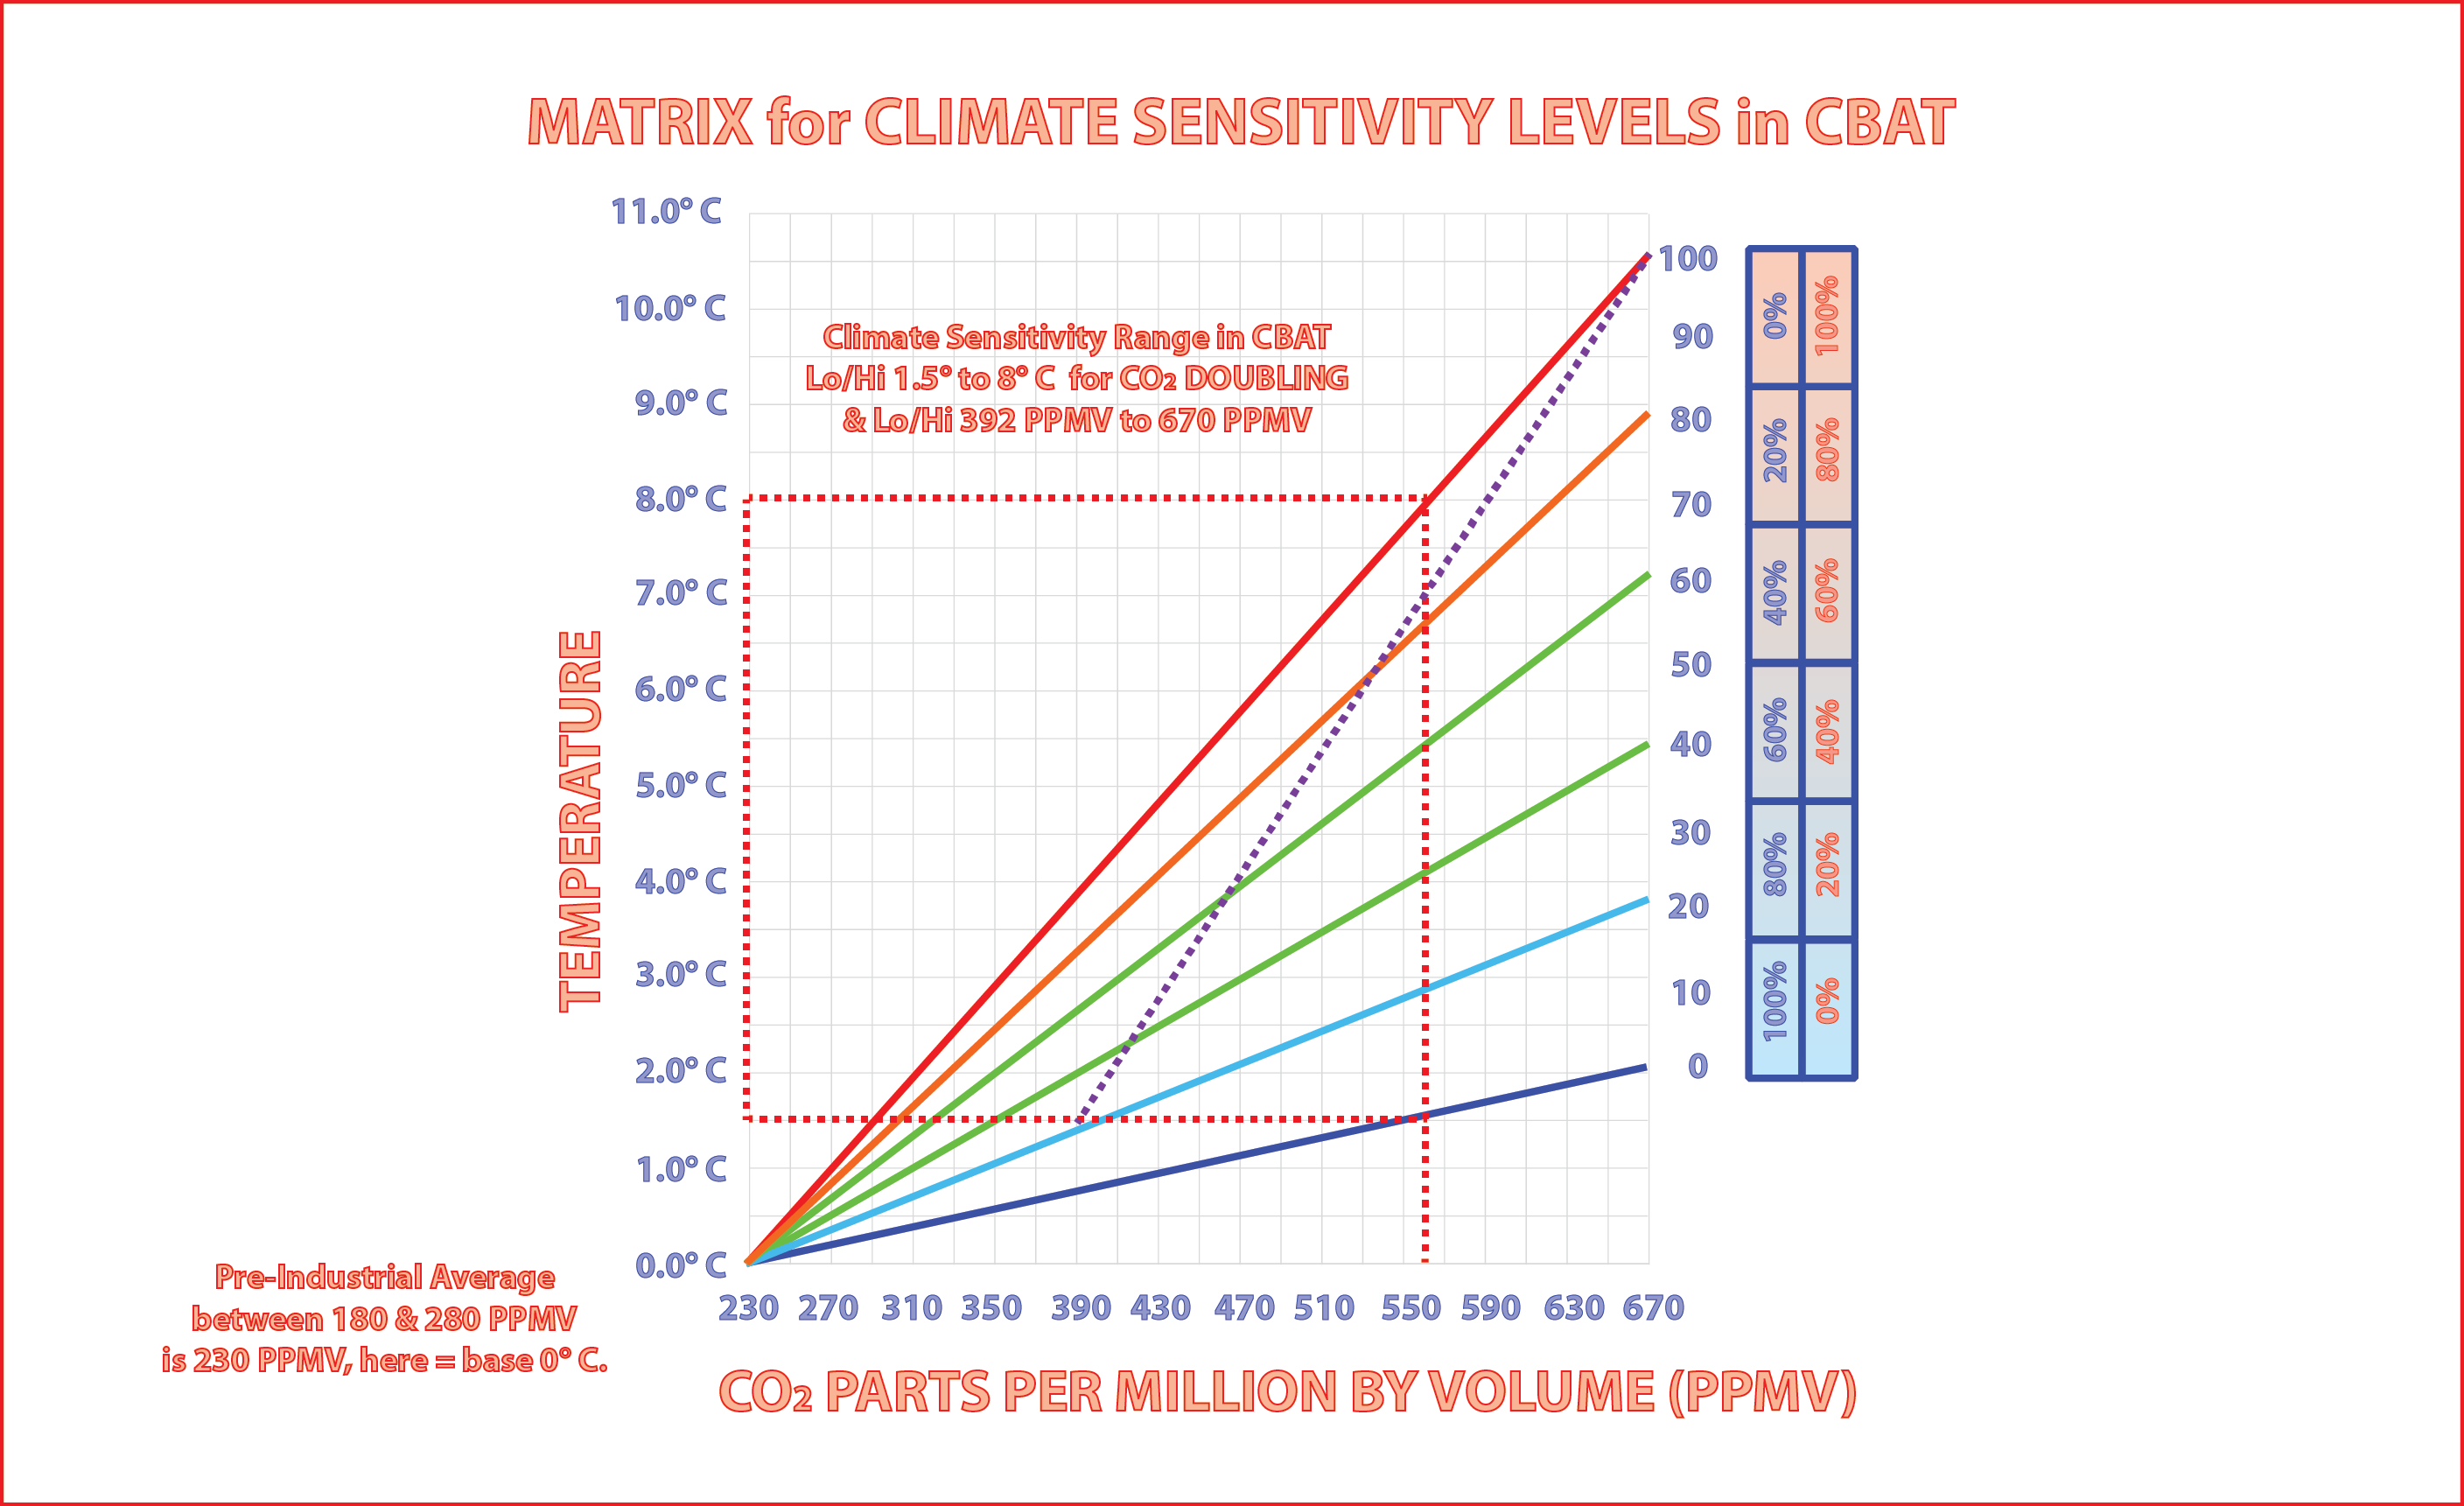
- Subject to a hi-lo range of 'Climate-Sensitivity' potentials (CS = T° @ 2*CO2 atmosphere) the decrease/increase of rates on a scale of from slight to severe (see here)
This MATRIX is based to 230 (not 280) PPMV, being the the pre-industrial average between 180 & 280 PPMV for several hundred thousand years prior to 1800 (see here).
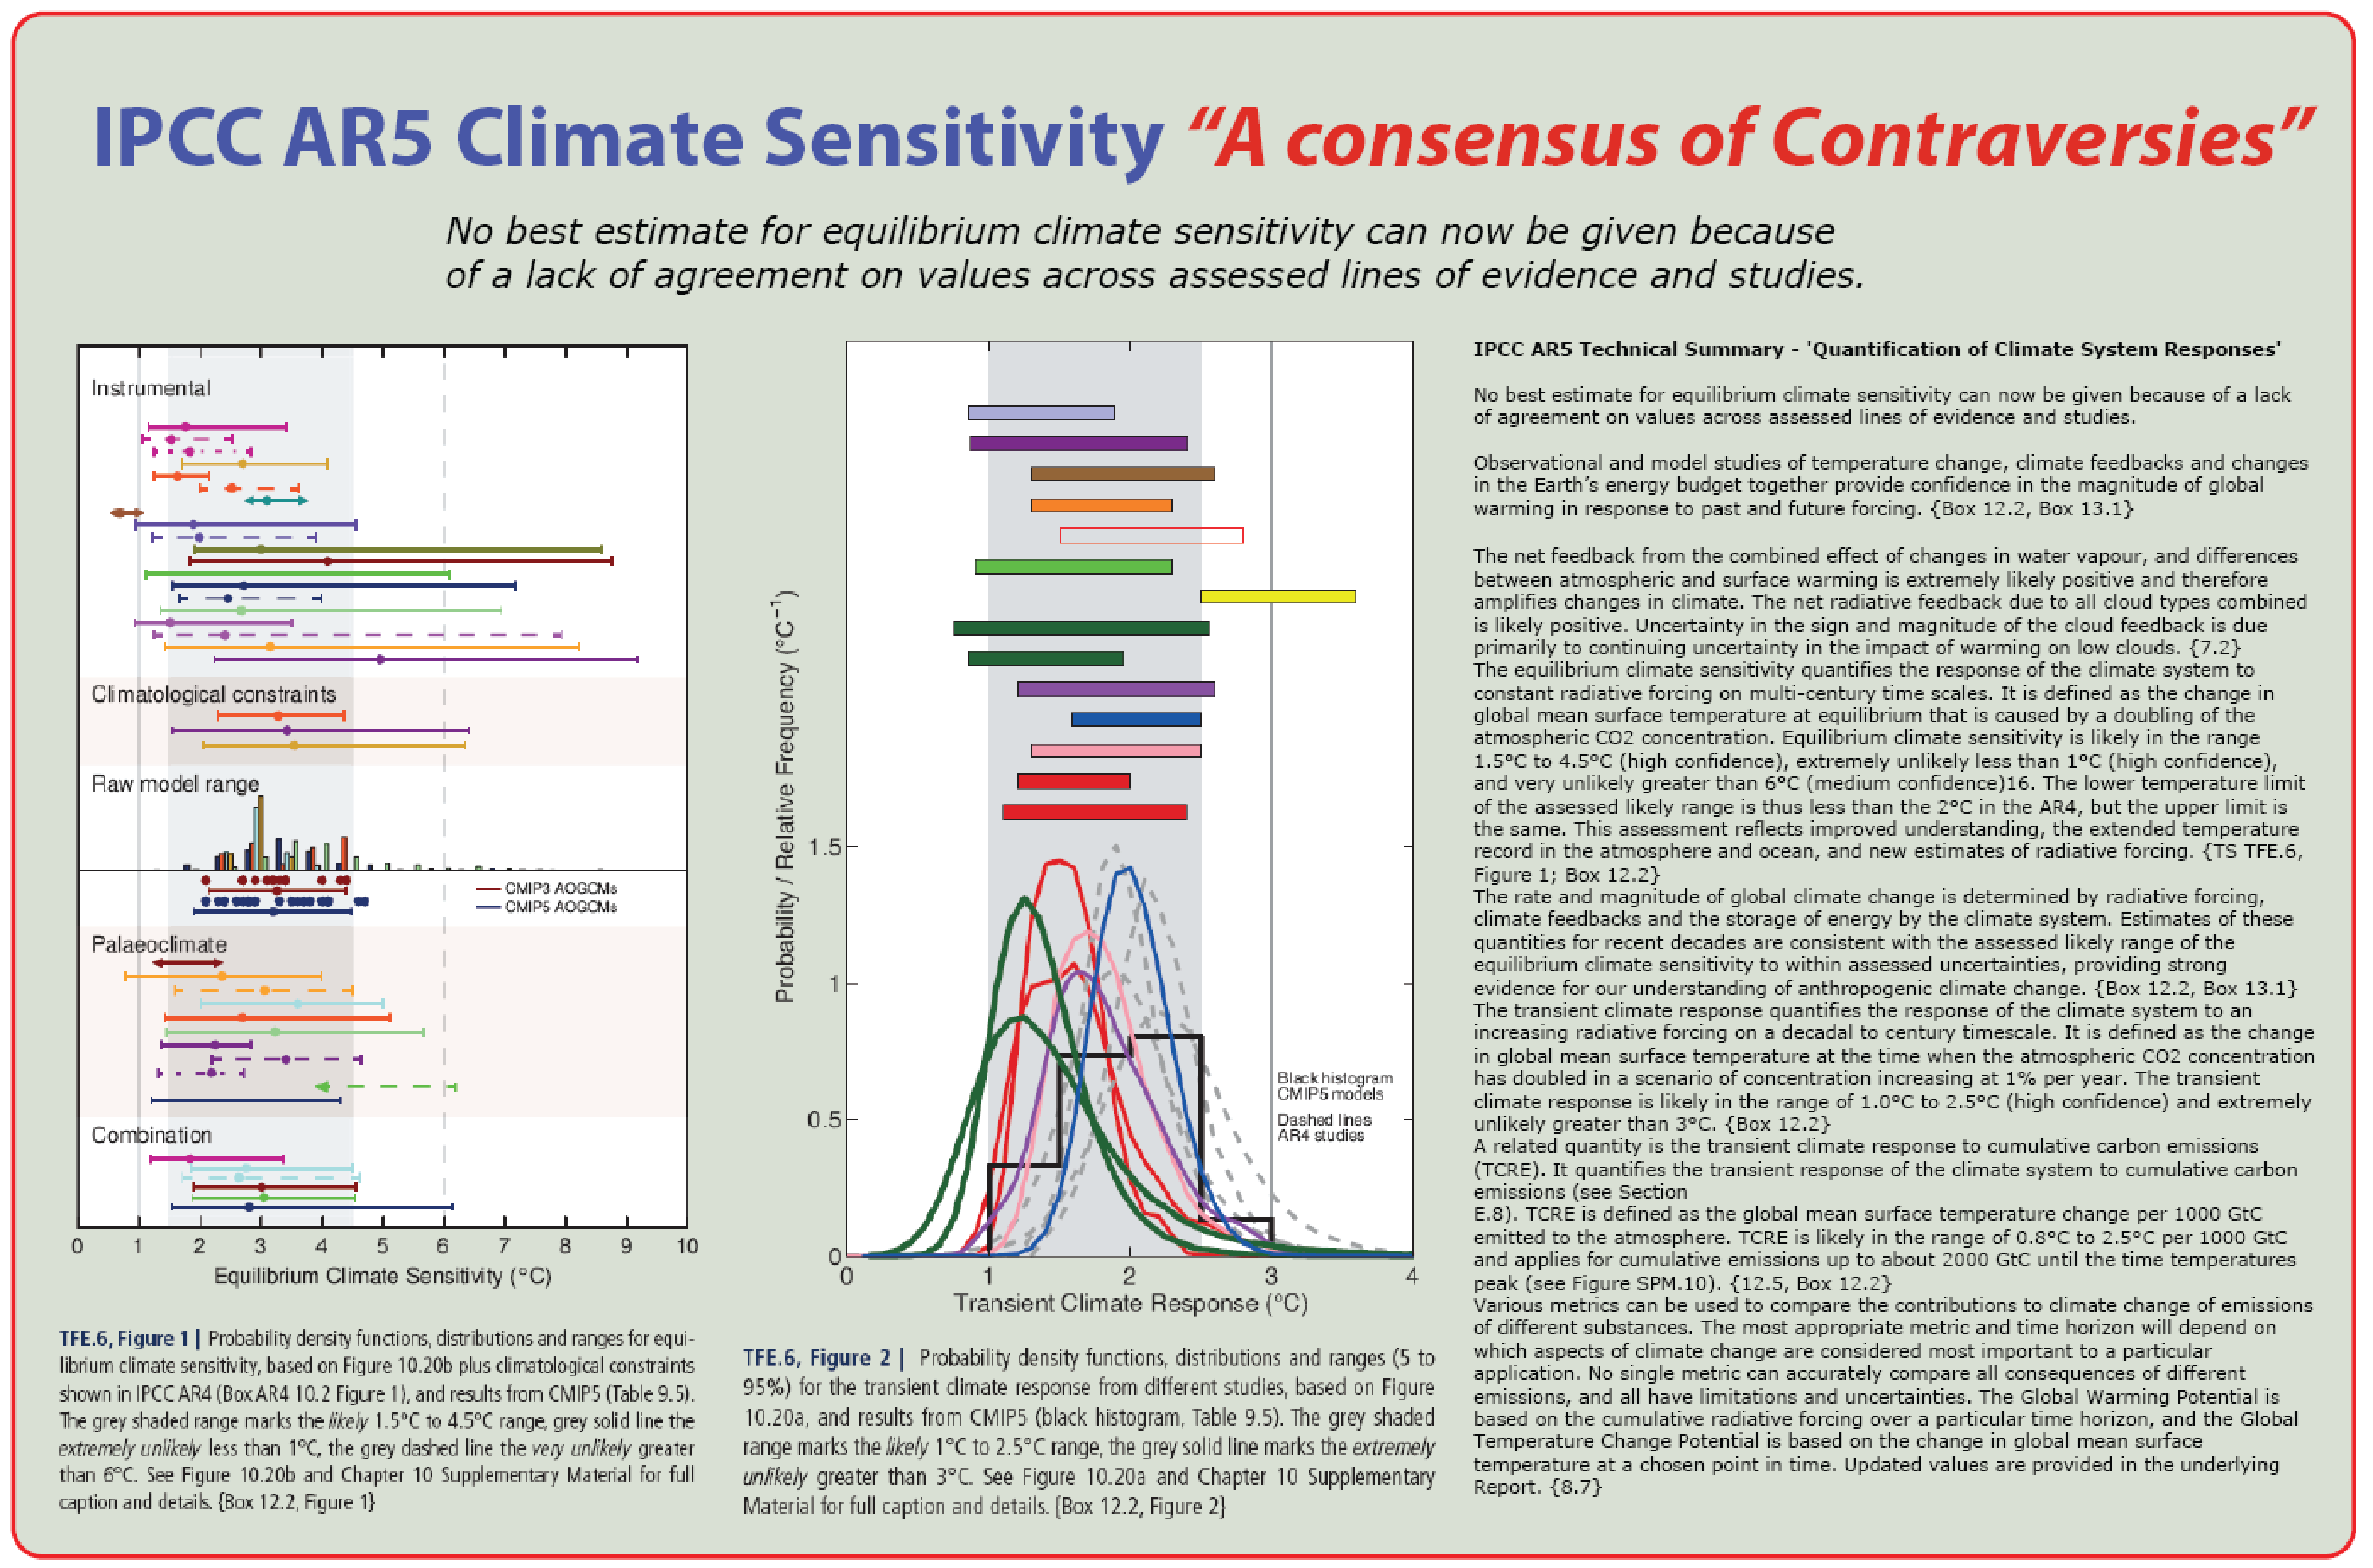
As IPCC AR5 shows, nested around lower values, Climate-Sensitivity is still a consensus of controversies (pdf). Significantly higher values are now being recorded.
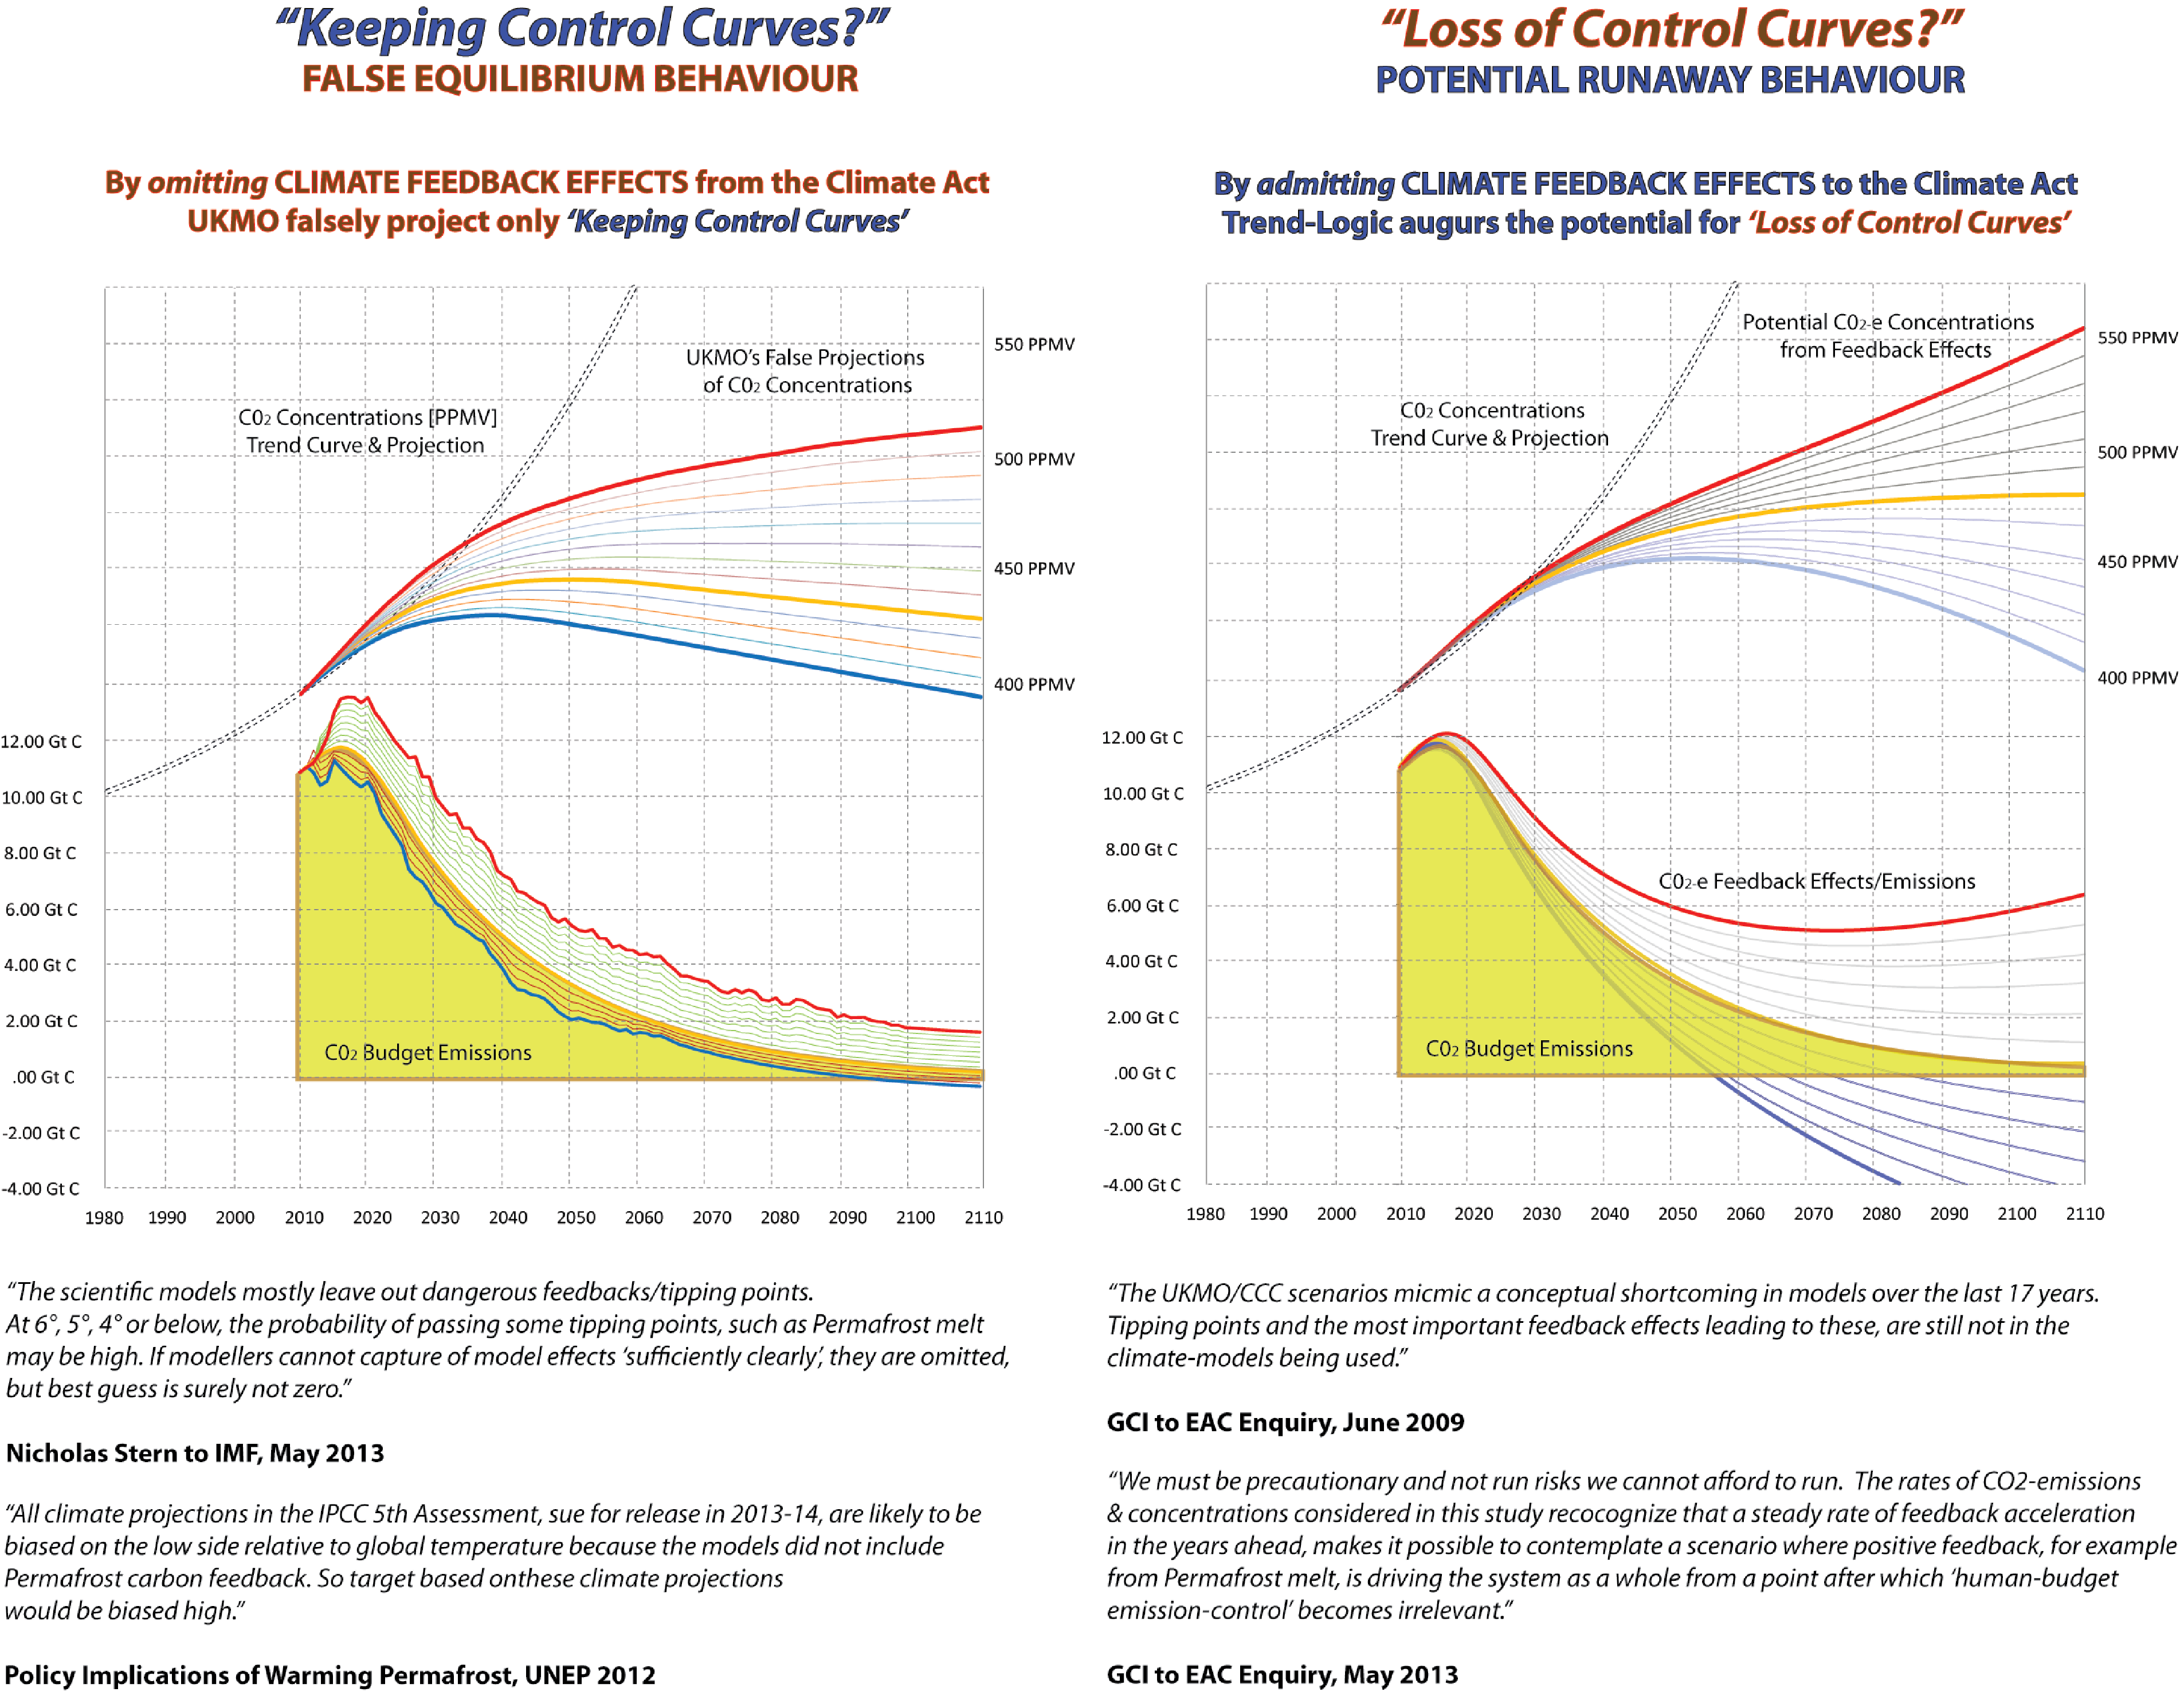
- What the difference of accelerating above or decelerating below CAF 50% represents is not so much a 'tipping point' as crossing or not crossing an event-horizon where staying below CAF 50% is a keeping-control paradigm but accelerating above it is a loss-of-control paradigm where we become powerless to arrest runaway rates of climate change. Balancing hopes and fears, we have to make the attempt to measure this.
- Dynamic Bar Charts for Temperature Rise, Sea Level Rise (see also here) and the rise in Ocean Acidity are present in Domain One, responding to the CBAT-user-choices made for [1] budget [2] feedback and [3] sensitivity. (Not shown in CBAT but here are changes in glacial mass globally over the last ~130 years. The WAIS collapse rate is here (NASA). A data-based historica' record over the last 600,000 years of the correspondence in level changes between CO2, CH4, Sea Level Rise & Temperature is here).
- For annual Transient Values (2010 to 2110) the Vertical Blue Line in the CBAT on-screen graphic is a 'draggable' Horizontal Slider. Year-to-year transient values in the table & chart are responsive for temperature, sea-level rise & increased ocean acidity,
responding to carbon-budget, feedback & Climate-Sensitivity choices here. ('Equilibrium Values' not shown). The obvious point revealed is that the Transients (moments in time) are governed by the Gradients (the 'slopes' or path-curvature over time) & not vice-versa.
There is generic confidence that the bigger, heavier & more time-extended the carbon budget is (in other words the more fossil fuel is extracted and incinerated), the more sign-positive feedback-effects & the higher Climate-Sensitivity values will be and deterministic in accelerating rates of climate change that result. The Vertical Sliders in CBAT demonstrate how its calibration reflects this.
Negotiators at UNFCCC are still asked to negotiate on a basis where RCP scenarios in IPCC just - as many have said, including Sir Nicholas Stern from the IMF - omit most feedback effects as a result of decisions that appear to reflect that it is just too hard to model feedback altogether, and therefore also just 'fixing' Climate-Sensitivity at the low values that result from these feedback-free models (note & note).
Despite a stated 'goal' of 2° C, we still avoid saying what the future Carbon Budget to meet that will be.
Consequently, prognosis for the rates of feedback-effects, PPMV, Temperature, Sea-Level Rise & Ocean pH are 'aggravated-unknowns' and in the circumstances, omitting feedback effects is not a sufficiently risk-averse procedure. Moreover, the rates of climate change now experienced show that, "using the past as a guide to the future will give us the wrong answer in most circumstances."
On the other hande, defining a 'carbon-budget' makes it possible to project and integrate feedback potentials and their consequences and so assess more reliably on a precautionary basis, what keeping at or below 2° C takes.
CBAT is intended to help build awareness of the key strategic point, namely that the smaller the carbon-budget, the less the impact on & from climate change.
As argued here, a 'socially constructed understatement' of the risks, fails to engage with the potential for Rapidly Inter-Acting Feedback Effects (RIAFE). On a precautionary basis an attempt to portray & measure this (also here) is vital. Even extreme projections (see the potential rates of methane release and zoomable image here) should not just be swept aside by conservatives.
Some current work on changing Airborne Fraction in the scientific literature is here.
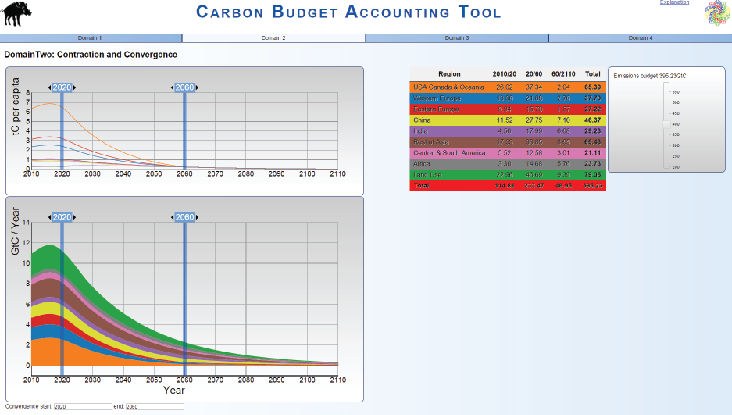
Domain Two is the now iconic C&C proposal. The global carbon budget total is internationally disaggregated into 9 categories (detail here, for emissions gross and per capita).
It shows a range of 'carbon-contraction-budgets' with a range of convergence rates where the total of the international parts chosen always
commutes with the global total chosen.
In other words, it quantifies & shows visually with animated graphics, numerical sliders and dynamically responding tables so: -
- The different sizes of global 'Carbon Contraction Budgets' calculated in Domain One (100 Budgets from 197 Gt C to 595 Gt C covering years from 2010 to 2110)
- Are calculated with all possible rates of international/regional Convergence onto the global per capita average of consumption arising
- And where future world fossil fuel consumption is laid out, differentiated only as 'optionally tradable shares' of available global carbon-consumption . . .
- So CBAT-users can pre-distribute with Horizontal Sliders these shares by varying the start-date and the end-date of the convergence 'window'
- With separation into 8 regions for shares of future fossil fuel emissions and one global category of emissions from Land-Use-Change
- Solid Vertical Purples Lines in the charts are the 'draggable' Horizontal Sliders,
- to which year-to-year transient values in the charts & table are responsive
- Domain 2 shows both gross (chart below) and per capita emissions (chart above)
- With the table showing the carbon-weights of shares arising for the lengths of three periods chosen of [1] before [2] during and [3] after convergence
- With a population base-year of 2010 having been set and considering it a matter for negotiators at the UNFCCC, as CBAT clearly shows: -
- C&C doesn't offer a prescription as to what the rates of convergence should be
- So much as a calculating syntax, or a methodology, where contraction governs convergence . . .
- Where whatever rates of convergence that are user-chosen, they are subdivisions of - & therefore commute with - the contraction total chosen by users in Domain One
- the assumption being that if the syntax is reversed with no pre-agreed budget,
- i.e. where contraction is made a function of convergence,
- by definition, the process remains decoherent and negotiations are likely to continue doing too little too late.
- The key throughout the 4 Domains of CBAT, is that each carbon budget user-chosen in D1 commutes with its sub-divisions in D2, D3 & D4.
- e.g the UK Climate Act budget 395 Gt C in D1 has sub-divisions under
- Contraction and Convergence (D2) and
- Contraction and Conversion (D3) &
- either of these under Growth and Damages (D4),
- remain the same budget total throughout all four Domains (unless or until the user changes this budget value)
- With the UK Climate Act for example,
- the budget-integral (395 Gt C)
- has convergence completing by 2050 as the horizontal slider in Domain Two can show,
- where
equality of 'entitlements, is achieved only after 35 years
- by when
81% of the '395 Gt C' global carbon budget has been consumed.
- In a nutshell, D2 calculates any rate of convergence, of any rate of contraction in D1 (100 budgets * 100 start-dates * 100 end-dates)
all in all providing a total of 1,000,000 user options of 'Contraction and Convergence.
- This methodology reveals that assertions by third parties, against or in favour of C&C, are meaningless unless the rates of C&C are specified,
and this effectively says that any strategic response to UNFCCC-Compliance is largely meaningless without full budget-analysis in all four Domains of CBAT.
DOMAIN THREE (D3) - Contraction and Conversion (C&C3) - Converting fossil fuel production/consumption to renewable alternatives - 'Green Growth'.
Domain Three quantifies & shows visually with numerical sliders,
and in dynamic tables and graphics the trend-relationships between: -
- a choice of the rates of contraction & concentrations and contraction & convergence' now expressed as (x)
- rates of 'contraction' subdivided as shares in proportion to source production/consumption in 2010 (as recorded by CDIAC) for: -
- coal
- oil
- gas
- cement
- flaring
- Land Use Change
- juxtaposed with rates of 'conversion' to a rainbow of the renewable alternative energy sources, being: -
- nuclear (fission fusion)
- Earth/Bio (would include biomass, geothermal, afforestation, reforestation, organic sink-enhancement, biomass/fuel etc)
- Wind (Windmills, Windfarms, off-shore on-shore, Helix technology)
- Solar (Photo Voltaic, Concentrated Solar Thermal Power, Solar Park)
- Water (Hydro, Tidal Turbines)
- Wave (a range of techniques here)
- with additional user-sub-choice of proportions of renewables and nuclear distribution moveable with the second Vertical Slider
- The key issue in Domain Three is that if fossil fuel use must be terminated, the energy demand gap must be met by non fossil fuel based production.
- No energy source/s can meet unlimited demand so overal demand will have to slow to some steady state in future.
- This is a *rates-challenge* the response to which need to be organized in preference to picking numbers out of a hat as though either of the above were not relevant.
- Again the point for negotiators at UNFCCC is that however hard this may be, projection planning like this is still preferable to picking number out of a hat
- as declaring success - doing-enough, soon-enough - while quite possibly doing too little too late would be a very poorly placed bet
- and continuing the randomness of a non-budget determined approach, could well lead to runaway and make a mockery of the whole exercise.
- Users can invoke Domain 3 or Domain 2 as the background to potential damage-rates in Domain 4 from doing enough-soone-enough versus too-little, too-late.
- Domain Three needs to be developed so emissions from fossil fuels (coal oil & gas) and Land Use Change can be controlled and resized individually
- Starting with any of the carbon budgets already programme in CBAT around the default of the UK Climate Act budget in Domain One . . .
- The results of doing this need an option to re-sum as global carbon budgets and fed-back to Domain One for reprocessing across all four CBAT Domains.
- CB AT Domain 3 helps to analyze the rates of conversion needed in what is already becoming a key battle-ground where there's a 'gap': -
- between the the rising risks of climate-instability and the requirement of UNFCCC-Compliance to avoid this, demanding a small carbon-budget
- but with renewable alternatives being painted into the corner of being 'unable to service demand-as-usual',
with the potential energy-gap created by that being exploited by vested fossil fuel interests.
- This reveals future path-potential mixing three tendencies which are . . . accepting: -
- high-climate-risk with a high carbon-budget because of 'slow renewables replacement rates' or
- that demand-as-usual (exponential growth) cannot be met and a steady state economy based on renewables becomes a goal or
- that with nuclear making up the gap between fossil-fuel removal and renewables replacement rates,
demand-as-usual can be met (i.e. that constant exponential growth is possible) . . .
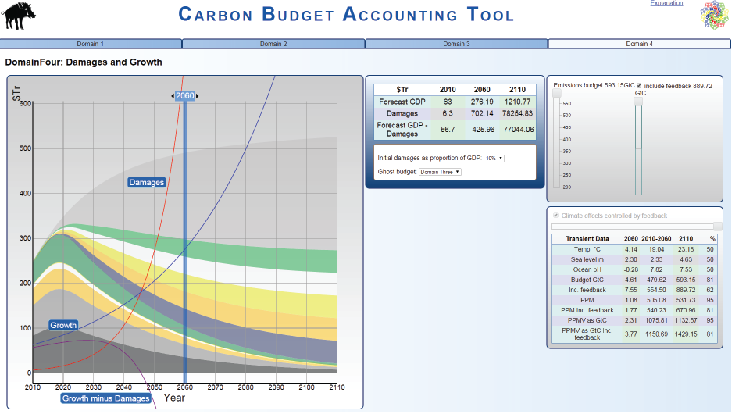
DOMAIN FOUR (D4) - Damages & Growth minus Damages - Comparing the benefits of doing enough soon enough with the costs of doing too little too late.
NB The solid Vertical Blue Line in the charts in Domains One & Four are the 'draggable' Horizontal Sliders, to which year-to-year transient values in both the tables are responsive.
Domain Four quantifies & shows visually with numerical sliders
and also in a matrix of dynamic tables & graphics, the trend-relationships between: -
- Global GDP 'Growth' starting at $63 trillion USD in 2010 with an assumed growth rate of a constant rate of 3%/annum thereafter
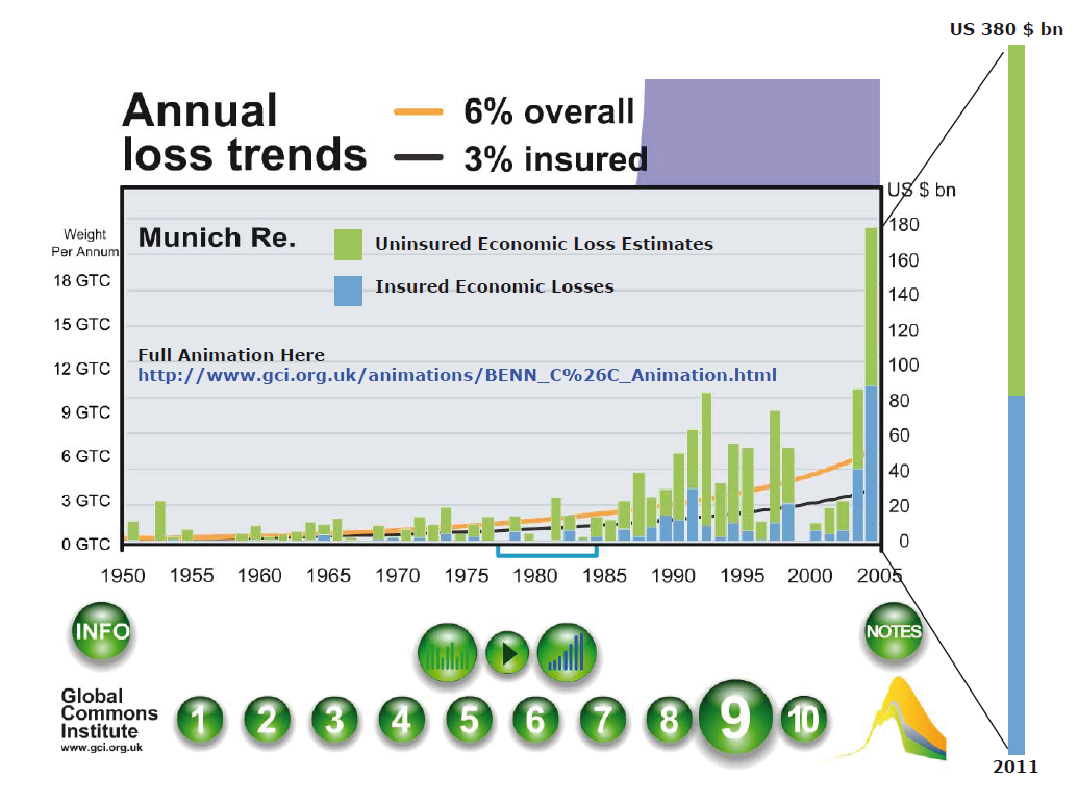
- Global Damage rates caused by climate change as calculated in CBAT from this MATRIX
- a user choice-array of start-values for global damages as a % of Global GDP from 1% to 10% of Global GDP in 2010 is in Domain 4 (Default setting is 5%).
- the current rate trend-rate for insured/uninsured losses combined as estimated by Munich Re at 6% per annum, starting at between 1 & 2% of Global GDP in 2010.
(The % of GDP in 2010 is conjectural; it could be put as much higher to reflect the loss of value in the global commons such as growing rates of biological extinction).
- Global Damage-rates responding to the [a] carbon budget [b] the feedback/sensitivity [c] % of GDP in 2010 user-chosen, in the arrays arising
- Global GDP rate net of these damage-rates arising are shown as well as 'Growth minus Damages'
- with a choice of being super-imposed over corresponding rates of either Contraction & Convergence (as in Domain Two) or Contraction & Conversion' (as in Domain Three).
- the key points being that: -
- unless the carbon budget is very low, albeit from a lower base value than GDP, climate damages easily accelerate to go faster than economic growth
- the higher the budget, the quicker the damages can actually over-whelm the growth
- the calculation of this growth compared with damages is very sensitive to
- the higher the start value for the percentage
of Global GDP in 2010, the faster the curve
- especially also once the potential for inter-actively accelerated rates of feedback & higher climate sensitivity is also recognized
- the 'stranded asset' potential from discontinuing high-carbon growth is a real & pressing matter, as this recent letter from the Governor of the Bank of England shows.
- Because Domain Four calculations are super-imposed on a background of Domain Three or Domain Two, it is possible reasonably to compare and calculate: -
- the value losses of fossil fuel assets stranded by divestment, if future fossil fuel use is attacked and collapses in a competitively decoherent manner, versus
- the losses of humanity stranded in poverty & runaway rates of climate damages, if rapid conversion-rates are not cooperatively planned & rapidly implemented.
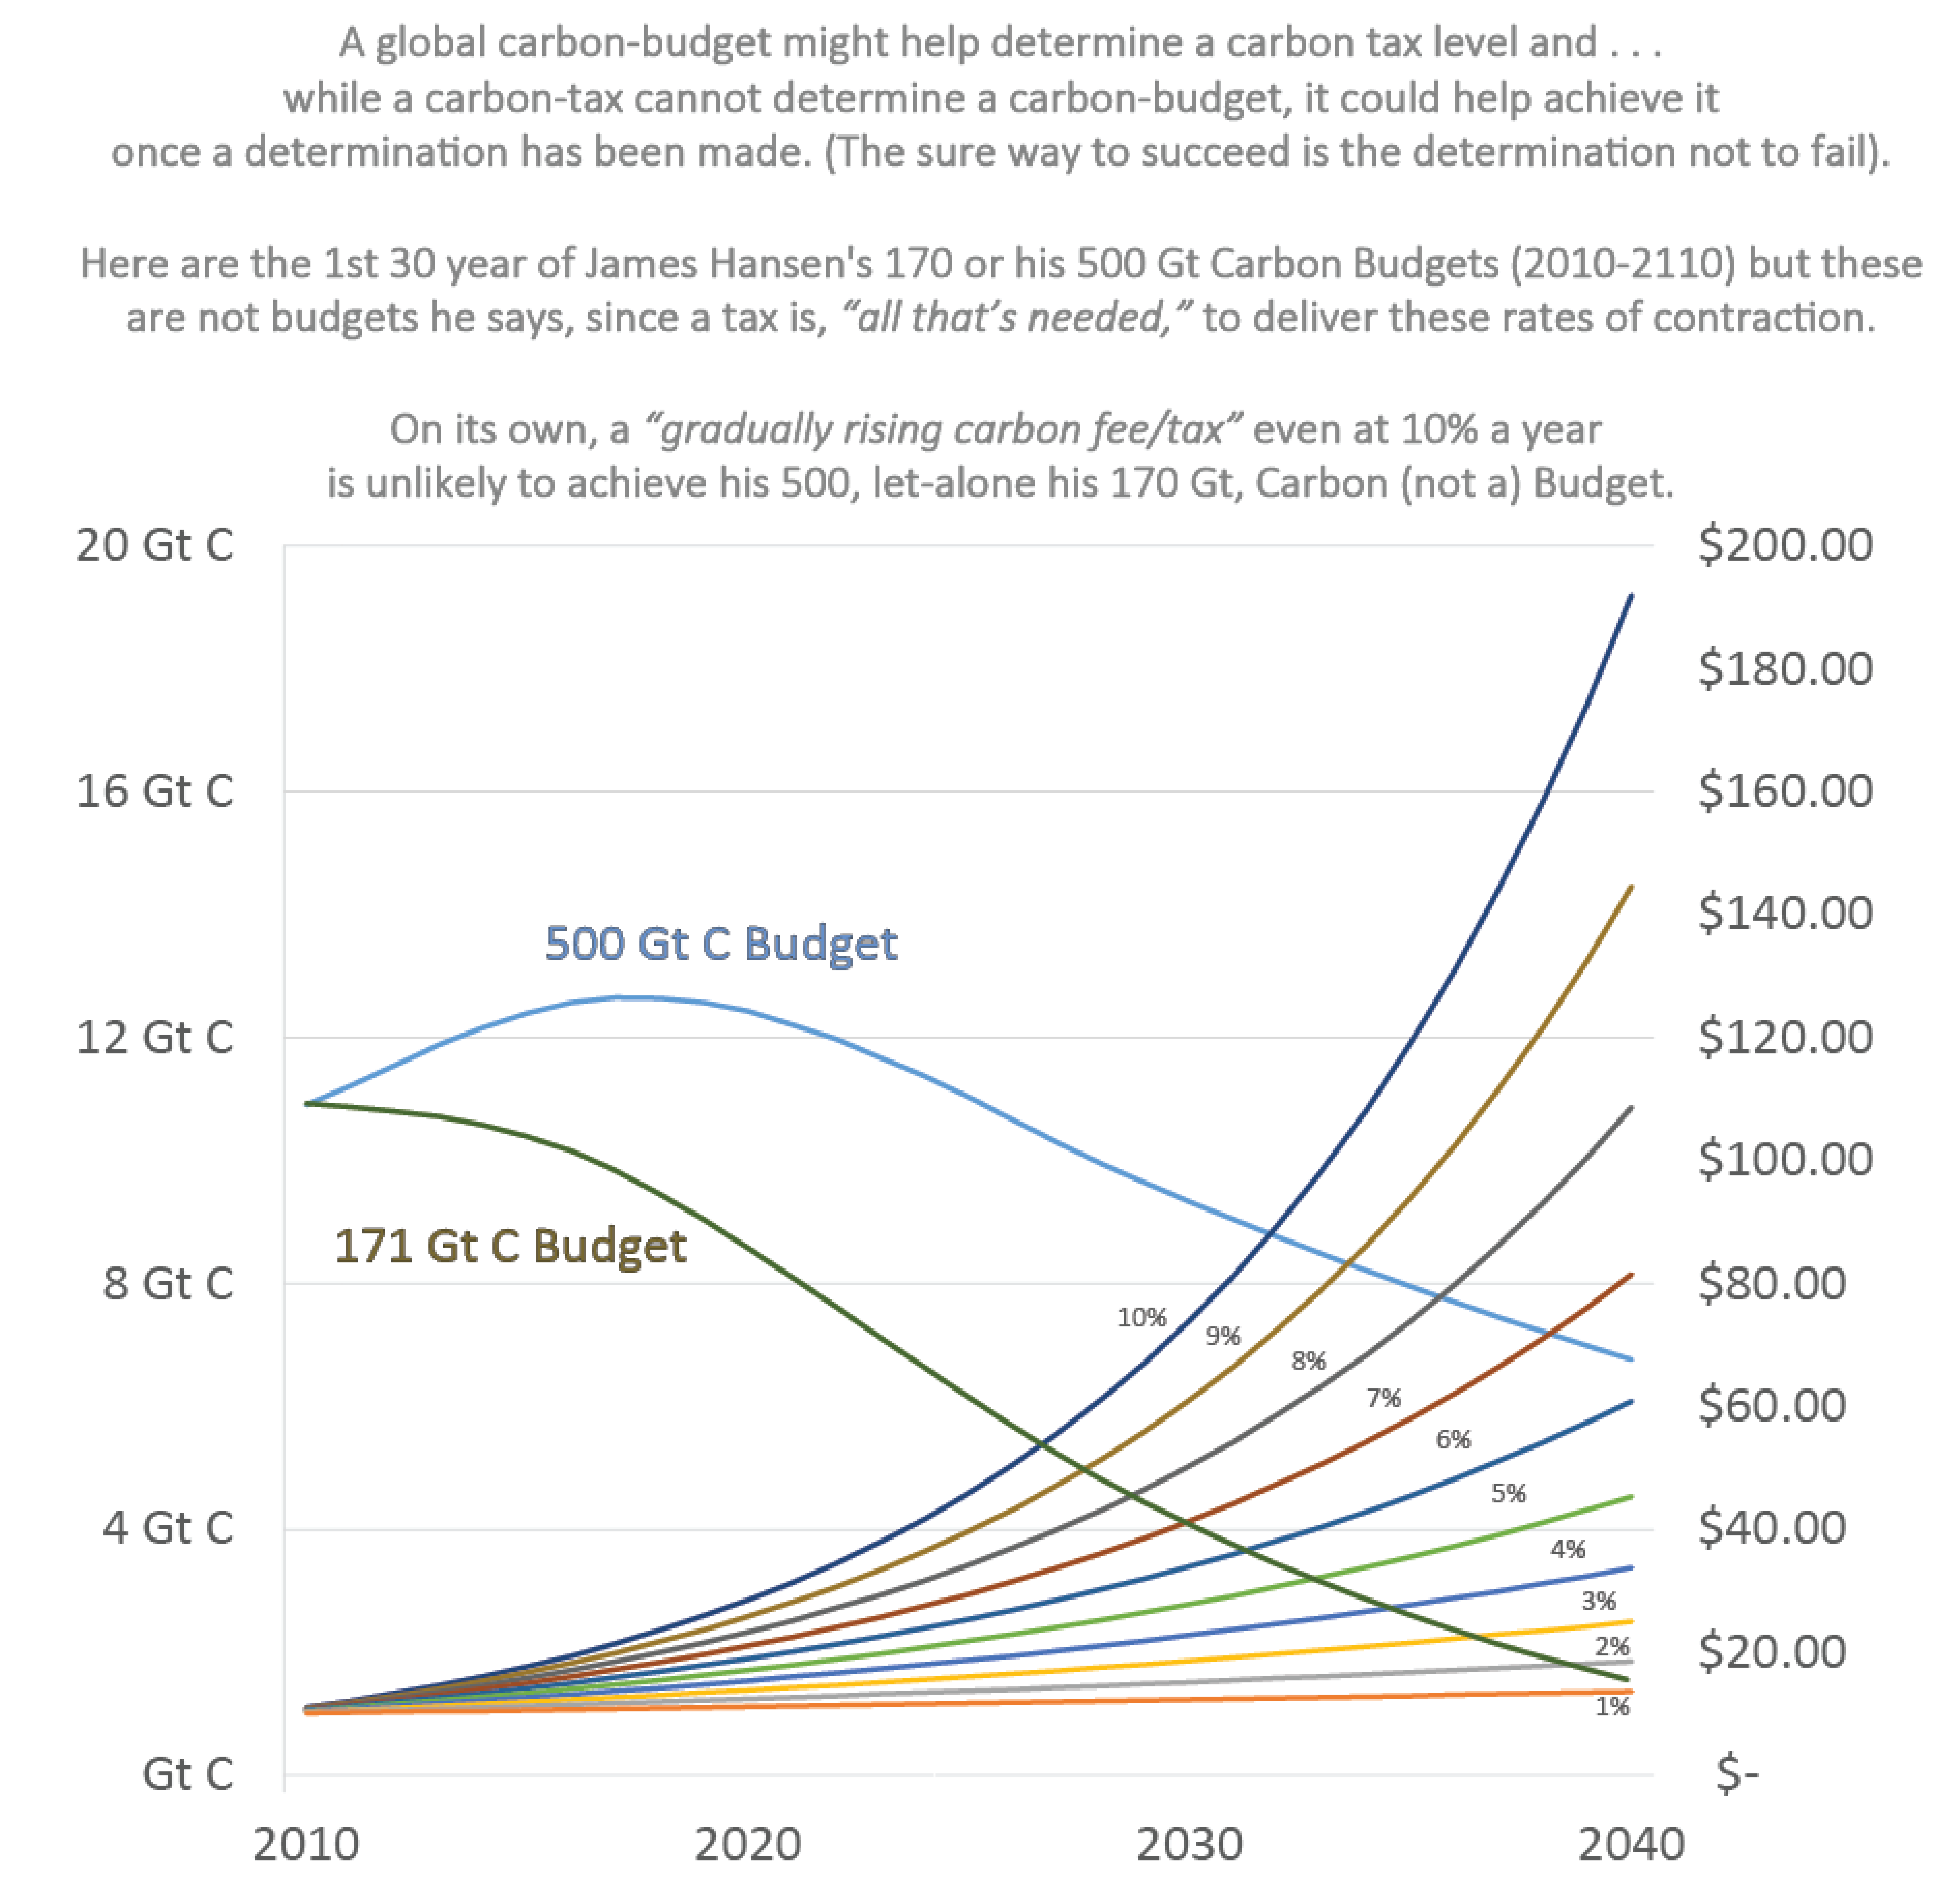
- Just a rate of carbon-taxation can not determine the rate of carbon-contraction (as James Hansen and his US constituency assert).
- However, the weight/rate/date of a carbon-contraction-event, if it was specified and regulated, could help to determine the rate of carbon-taxation (image).
- Here is a note on carbon-tax and C&C.
The relationship between GHG emissions and their concentrations in the global atmosphere, is a stock:flow relationship.
This is a simple relationship like that of a bath (the stock) into which a tap flows & from which the plug drains away
However, the following past and present features are significant in relation to the 'futures' projected in CBAT
Particularly with this lack of 'rate-precedents' in mind, CBAT is aimed at everybody (experts to student to casual observers) whatever we decide to do about the rates of mitigation that are necessary for UNFCCC-Compliance, as the decision both involves and affects us all. Perhaps this takes the terror out of, 'the terrifying maths' by actually doing it rather than just saying it needs to be done,
or statistically averaging and blurring what is done based on assuming and asserting change-rate precedents, that don't in fact exist (***).
All this means in the pursuit of UNFCCC-Compliance on a precautionary basis, is that goal focusing on 100% renewables & 0% fossil fuels by 2050 with a rates analysis of the all-sector strategic organisation of effort needed to achieve it is sine-qua-non to success.
CBAT clearly shows this will not happen 'by accident' or only as a result of having 'good intentions' in burgeoning clusters of error-bars, probablity-density-functions and
market-based trade-offs between present ignorance of past errors and future comfort-zones, where future-climate is assumed to be a 'wholly owned subsidiary of the economy'.
Evolution that is based on accelerating that rate of entropy by burning fossil fuels, must be replaced as quickly, as as possible by 'political evolition'.
This means that ideology must be replaced by teleology, by a low entropy goal-focus with political-will harmonized to that purpose.
Here is a very rough cut CBAT draft demonstration video.
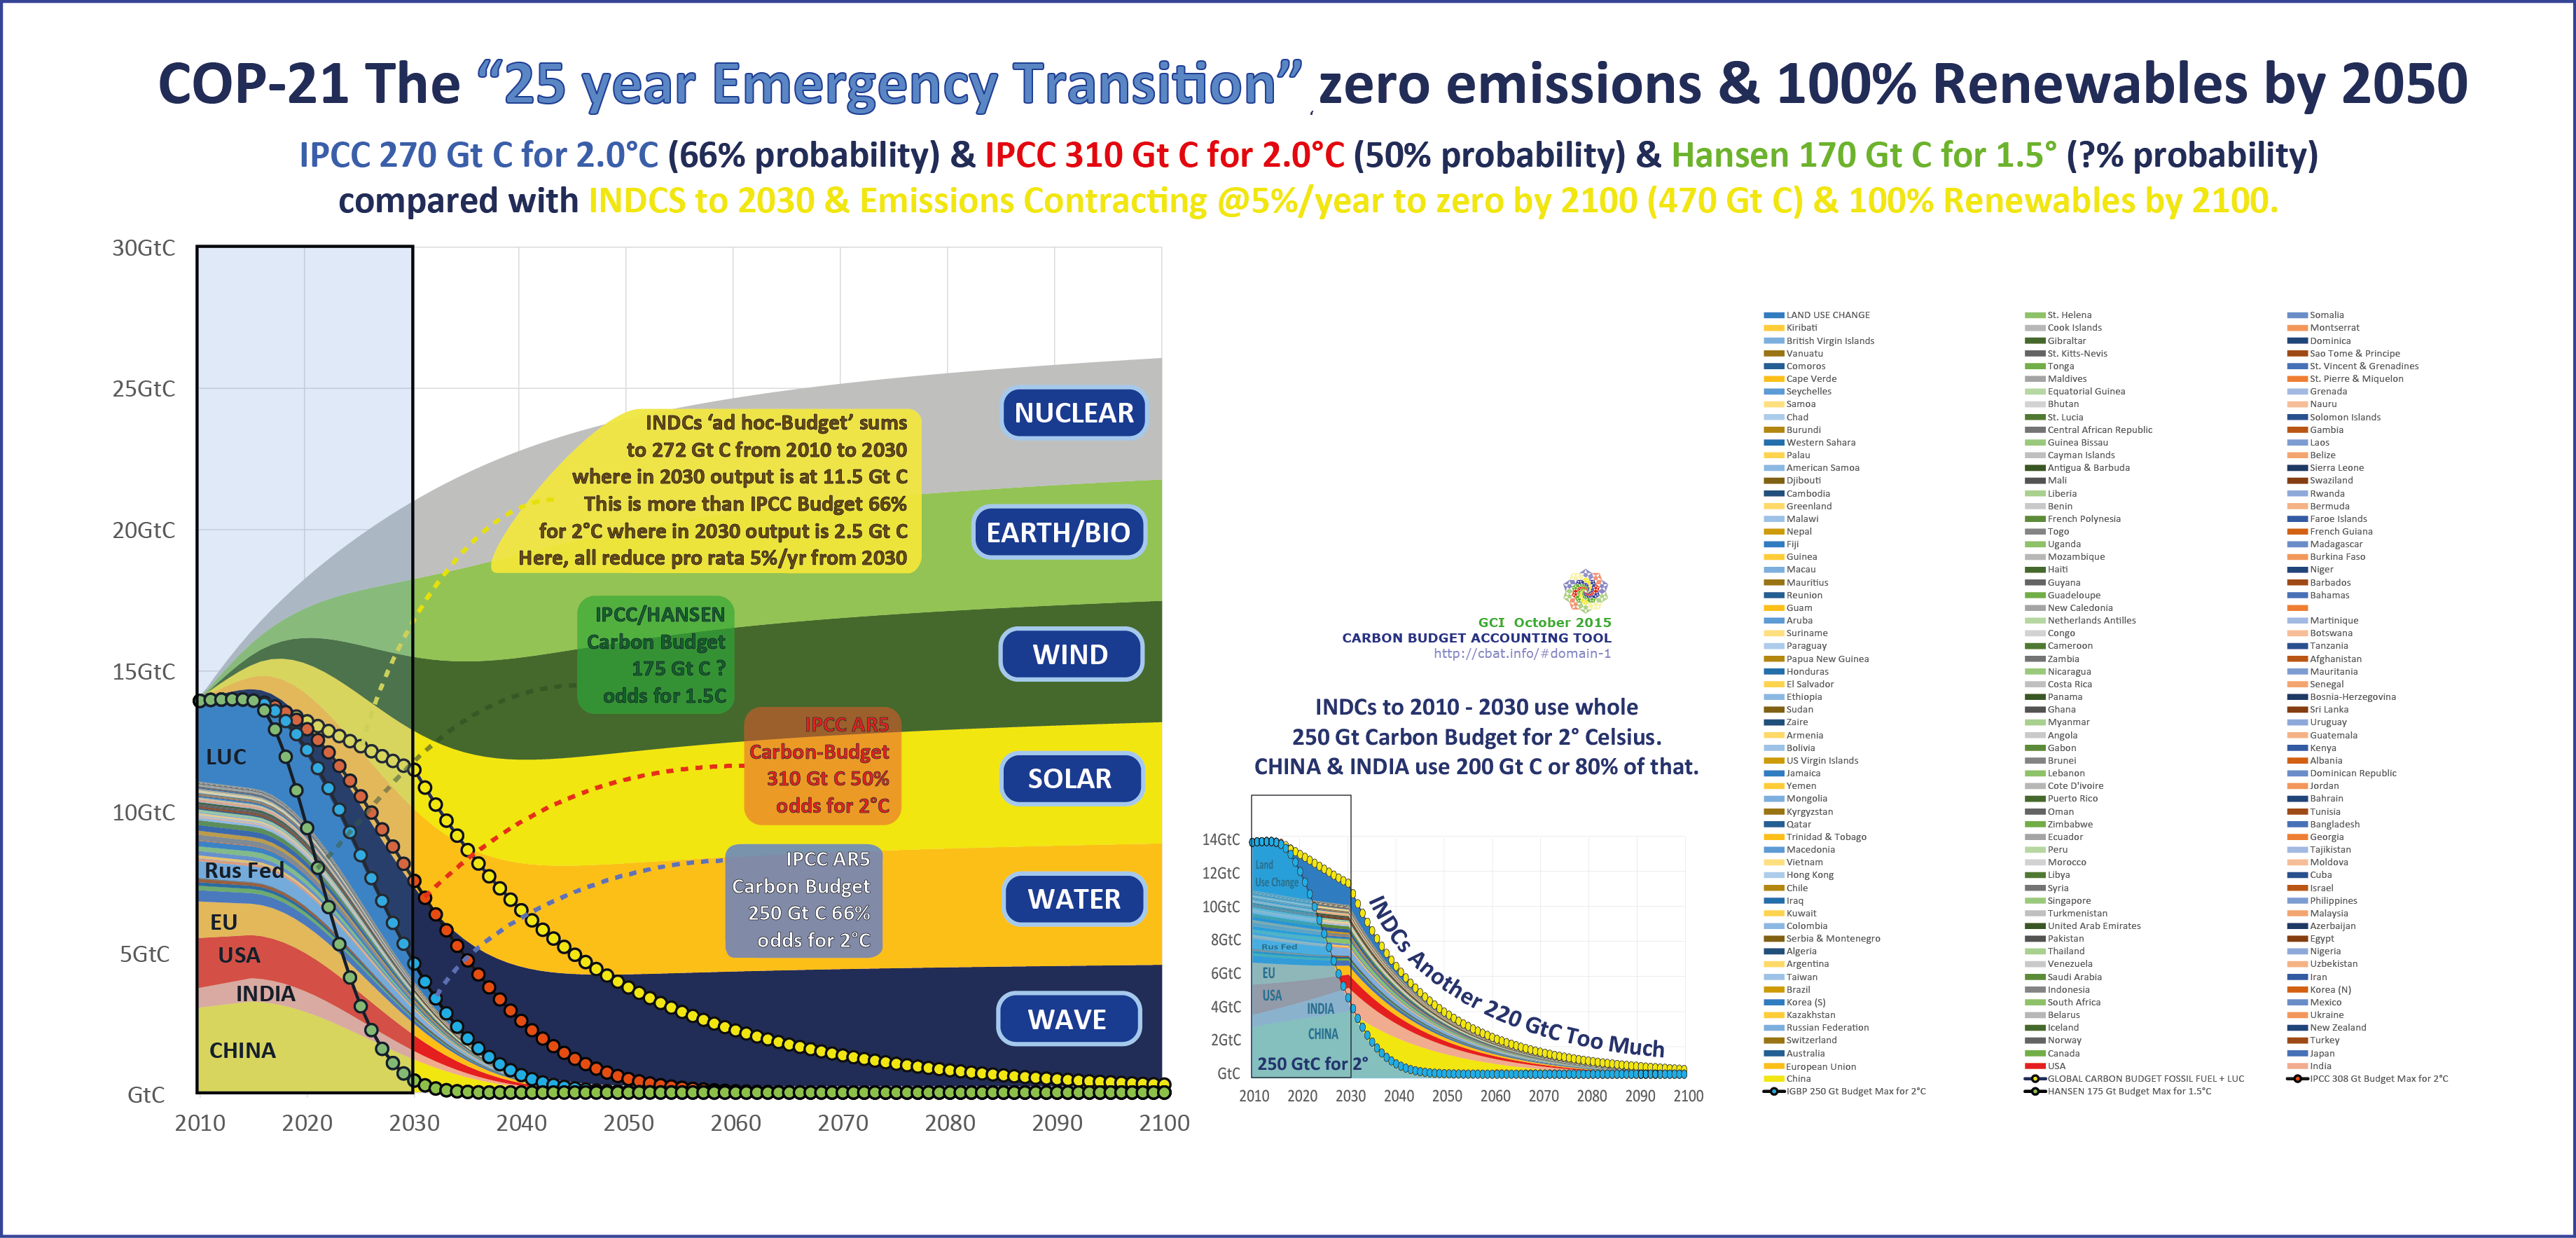
IPCC AR5 Carbon Budgets
for 2°C
|
|
 Click logo to return to 'links-page'
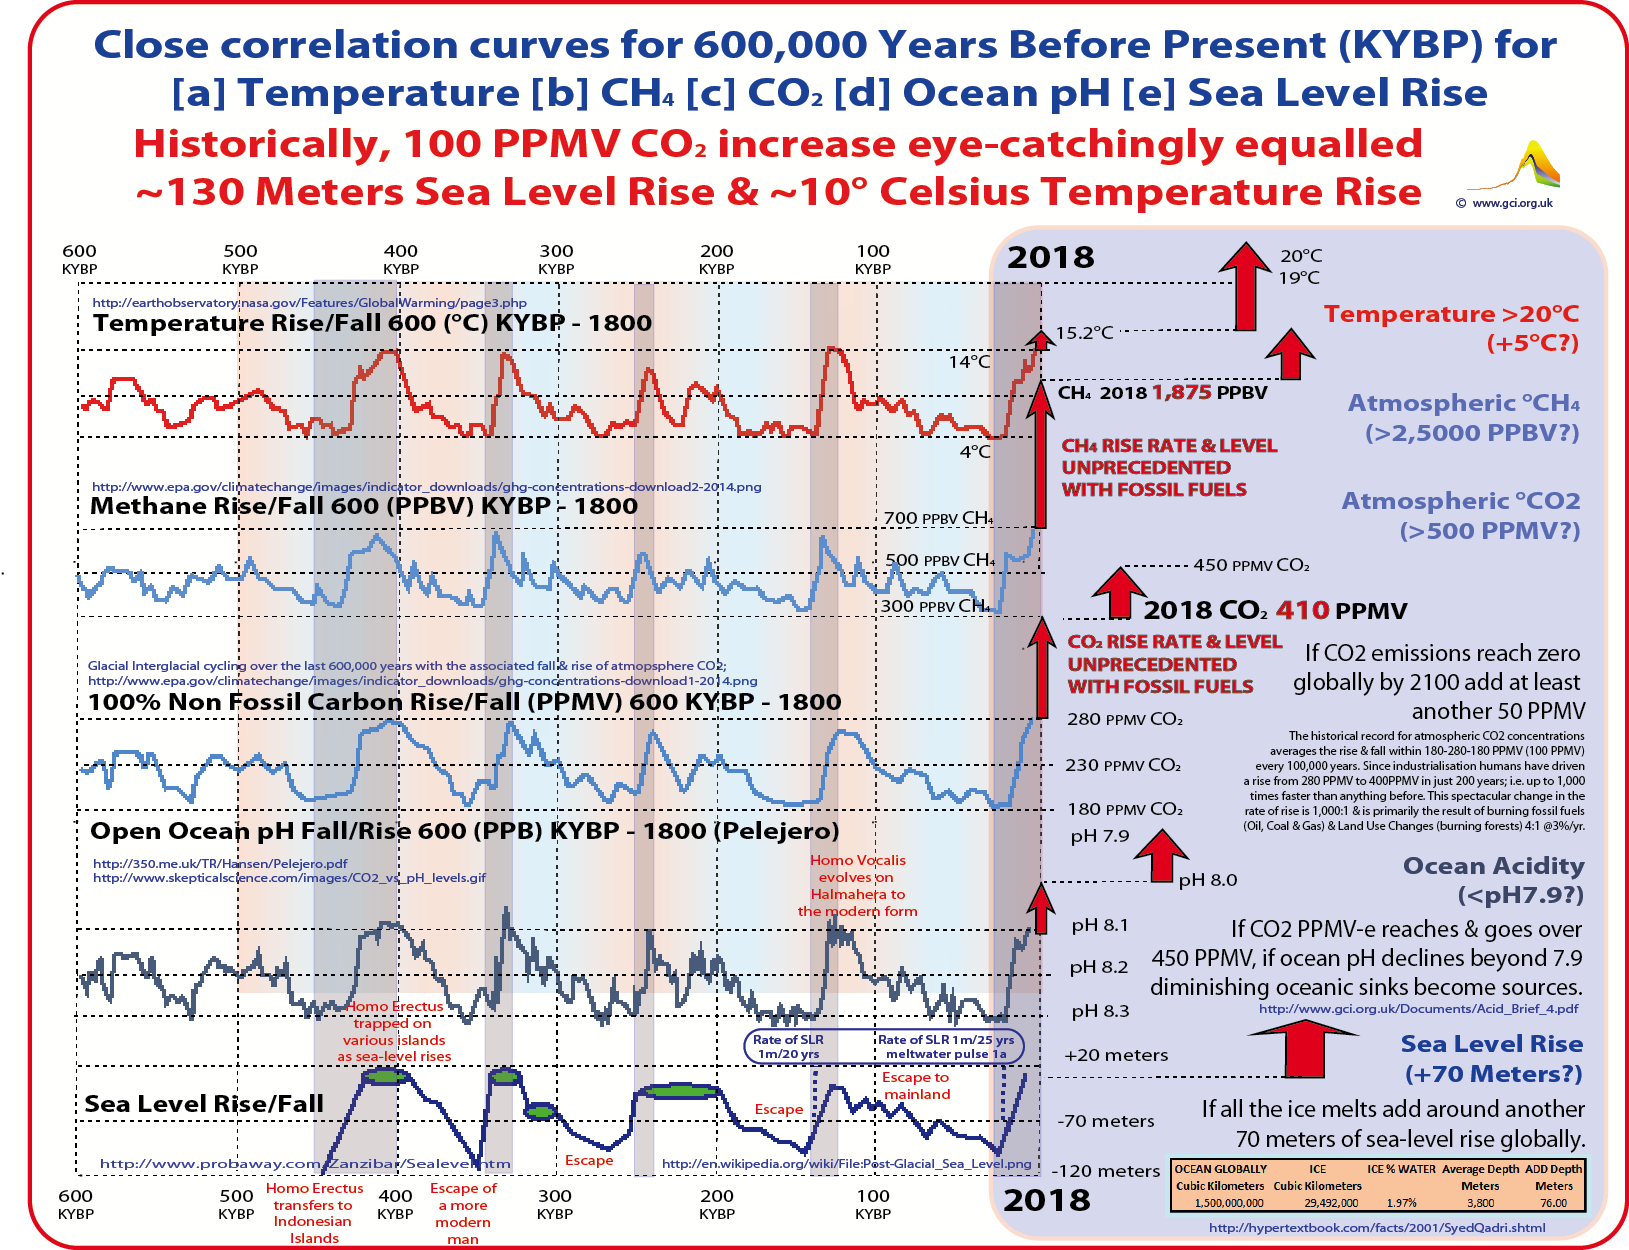