IPCC SR 1.5 - Table 2.2 & 'Addditional' Warming estimates (AWE - 2006 to 2015) ?
- Greta Thunberg
- Greta Key messages
- Table 2.2
- Additional Warming Estimates
- Budget Integrals
- Budget Integrals per unit time
- the Feedback Issue - including the bath-tap-plug analogy
- Acceleration; Early-Onset Runaway-Rates of Climate-Change
- We were lied to
- Adair Turner & the UK Climate Act
- Alliance for UNFCCC-Compliance
- International Support
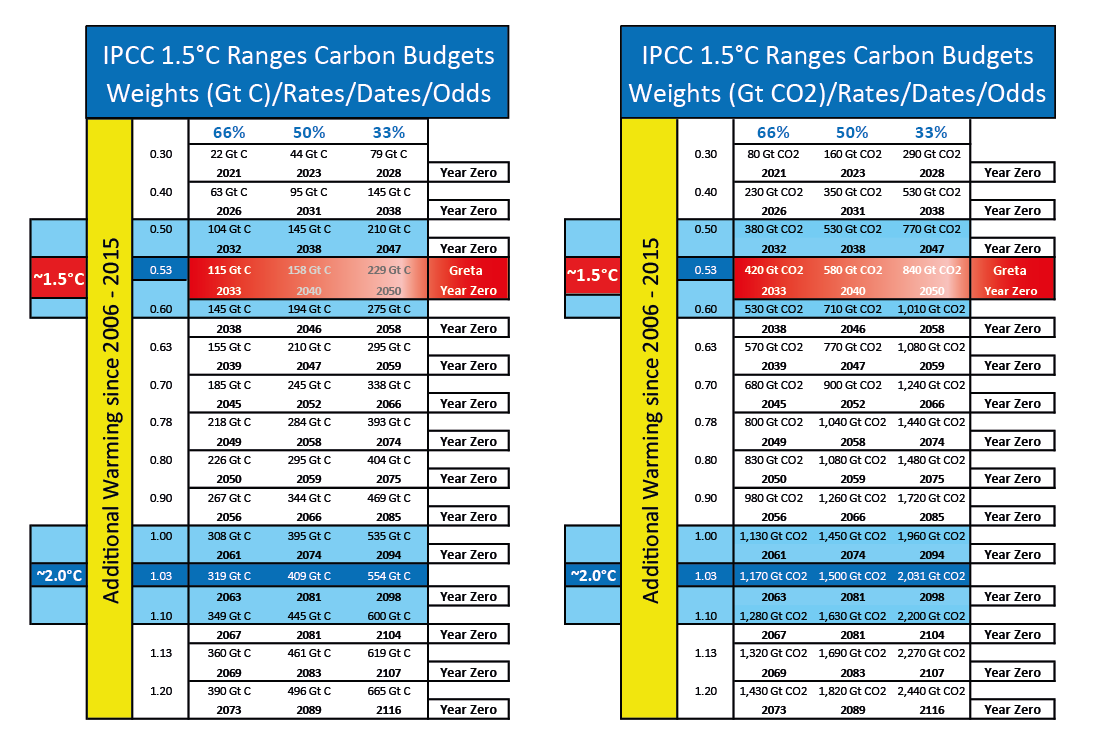
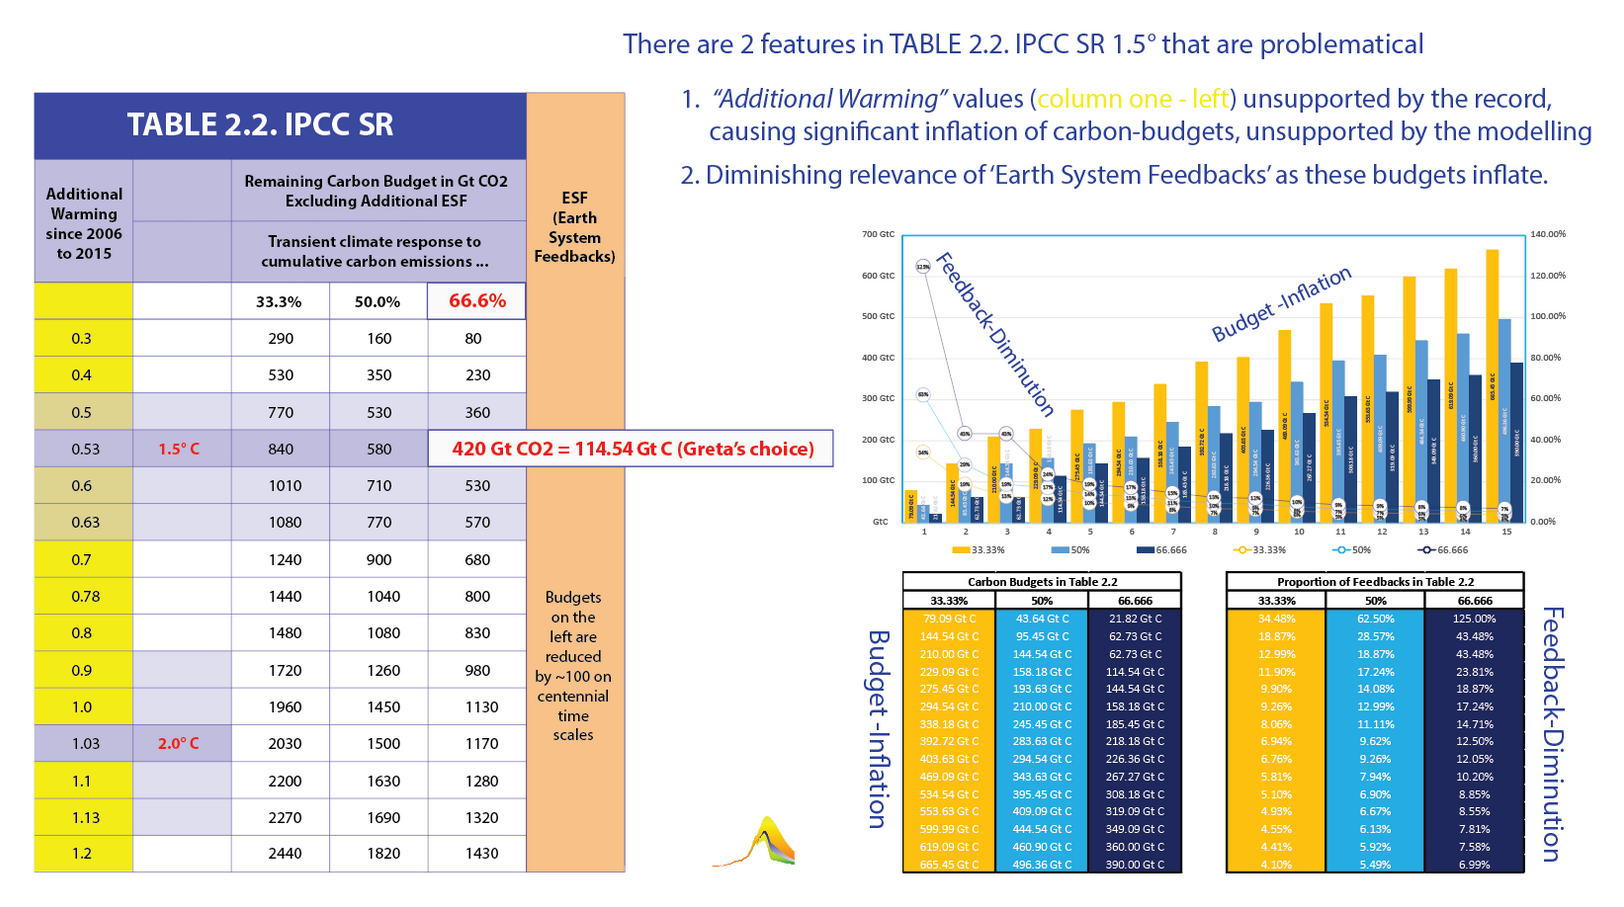
Below are the numbers in Table 2.2 converted between Gigatonnes Carbon only (Gt C) & Gigatonnes Carbon Dioxide (Gt CO2).
The left-hand column is designated, "Additional Warming (AWE) since 2006–2015" [°C] with a range of estimates ( 0.3°C to 1.2°C)
showing that while all budgets do go to zero emissions by a given date (vide "The Remaining Carbon Budget"): -
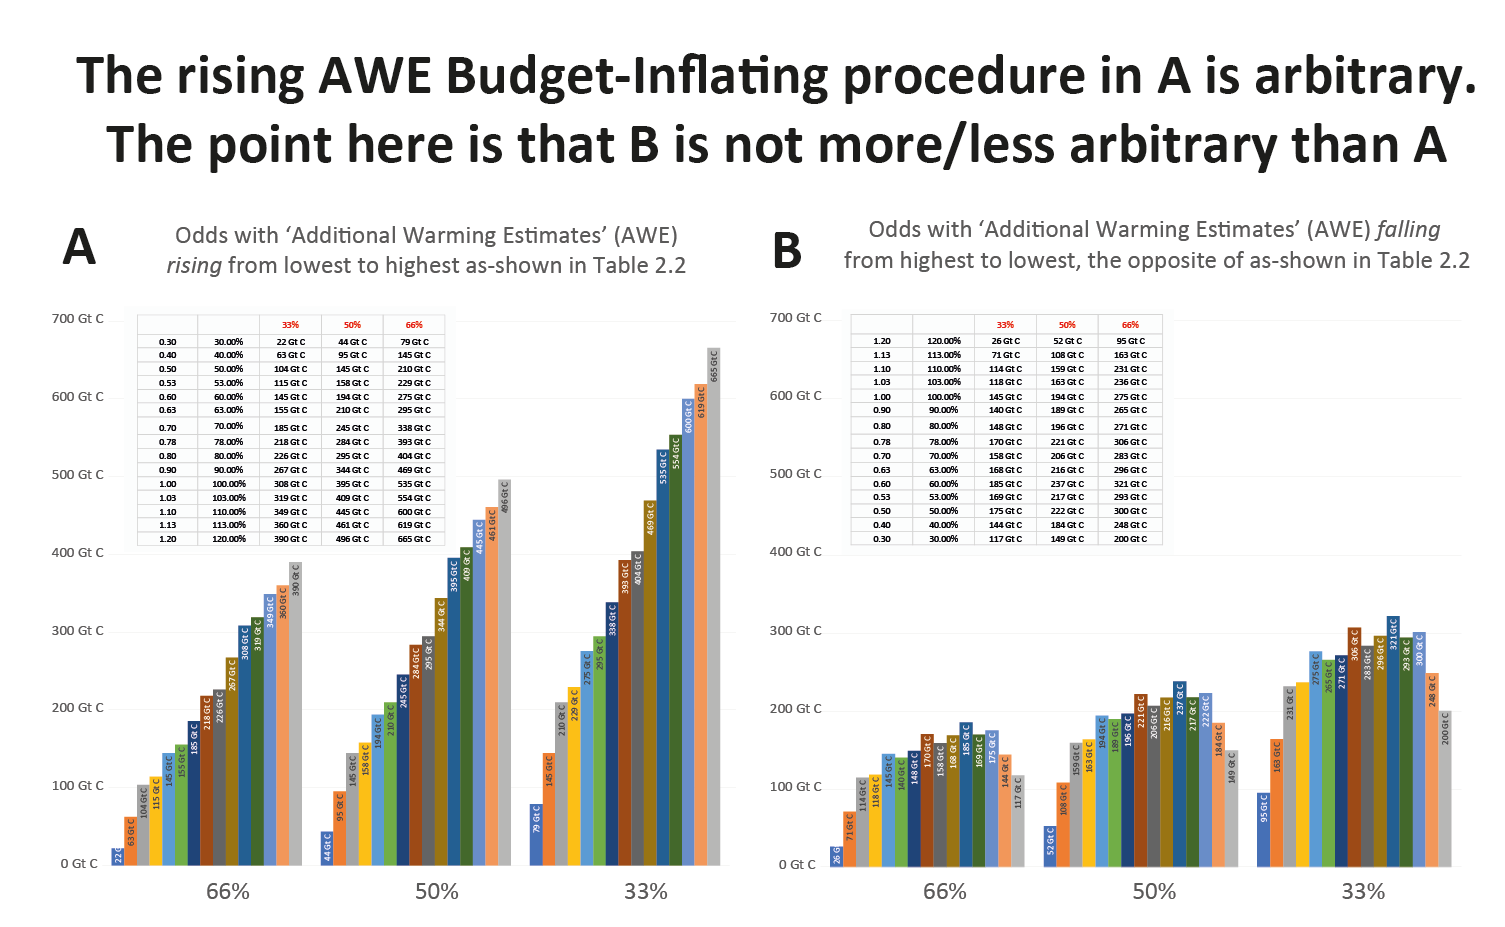
- an increase in 15 steps of AWE graded from lowest (0.03°C) to highest (1.2°C) as the 15 carbon-budgets expand,
- the AWE values demonstrate an increase from 100% to 400% as an 'uncertainty range'
- which is an unreliably large range for the very short & recent period of 2006–2016 (see below).
- That done, the odds (probabilities, 66%, 50%, 33%) are only then projected as a function of that actual 400% increase
- and this (arbitrary but loaded, even casino-like procedure) appears to explain why in the 15 year sample period the: -
- the carbon budget values increase so much (by weight) &
- the year-zero in each case becomes so late (the rate)
- where the weight-gain:rate-loss is quite counter-intuitive
- assuming UNFCCC-Compliance is the agreed purpose
- as the higer the temperature the larger the budget (making Compliance less and less likely)
- & not vice versa (as one would expect)
- No more arbitrary than steps 1. & 4. (above), when the order of AWE is reversed (from highest to lowest)
- carbon budget inflation is less counter-intuitive (as one would expect) as it is halved.
Step 1. certainly appears to be a very uncertain procedure, where the 15 steps are graded from lowest to highest, so
the effect on budget-sizing is a significant degree of inflation (from the smallest at 22Gt C to the highest at 660 Gt C).
The UNFCCC-Compliant reality is that carbon-budget-sizing is more an integrated precautionary policy issue than a
scientific probability-issue. This means that safer means the smaller and faster the budget the better and vice versa.
Additionally, any remaining carbon budget that is safe & with better odds of success than not, needs to be internationally shared
on the basis of equity for that success to occur, as emphasized by Greta Thunberg. This integration is an argument in favour of
a non-random Alliance for UNFCCC-Compliance as soon as possible at stringent rates of Contraction & Convergence.
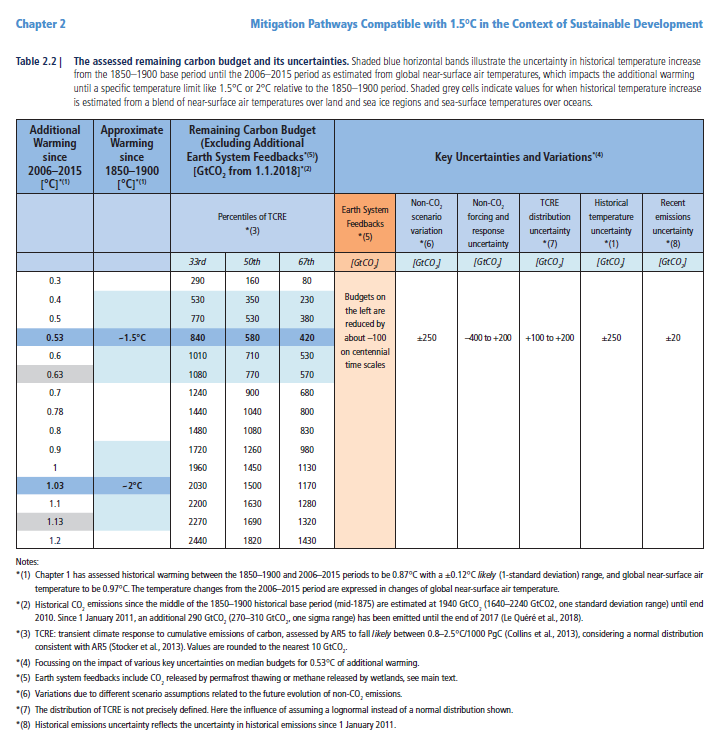
Original Table 2.2
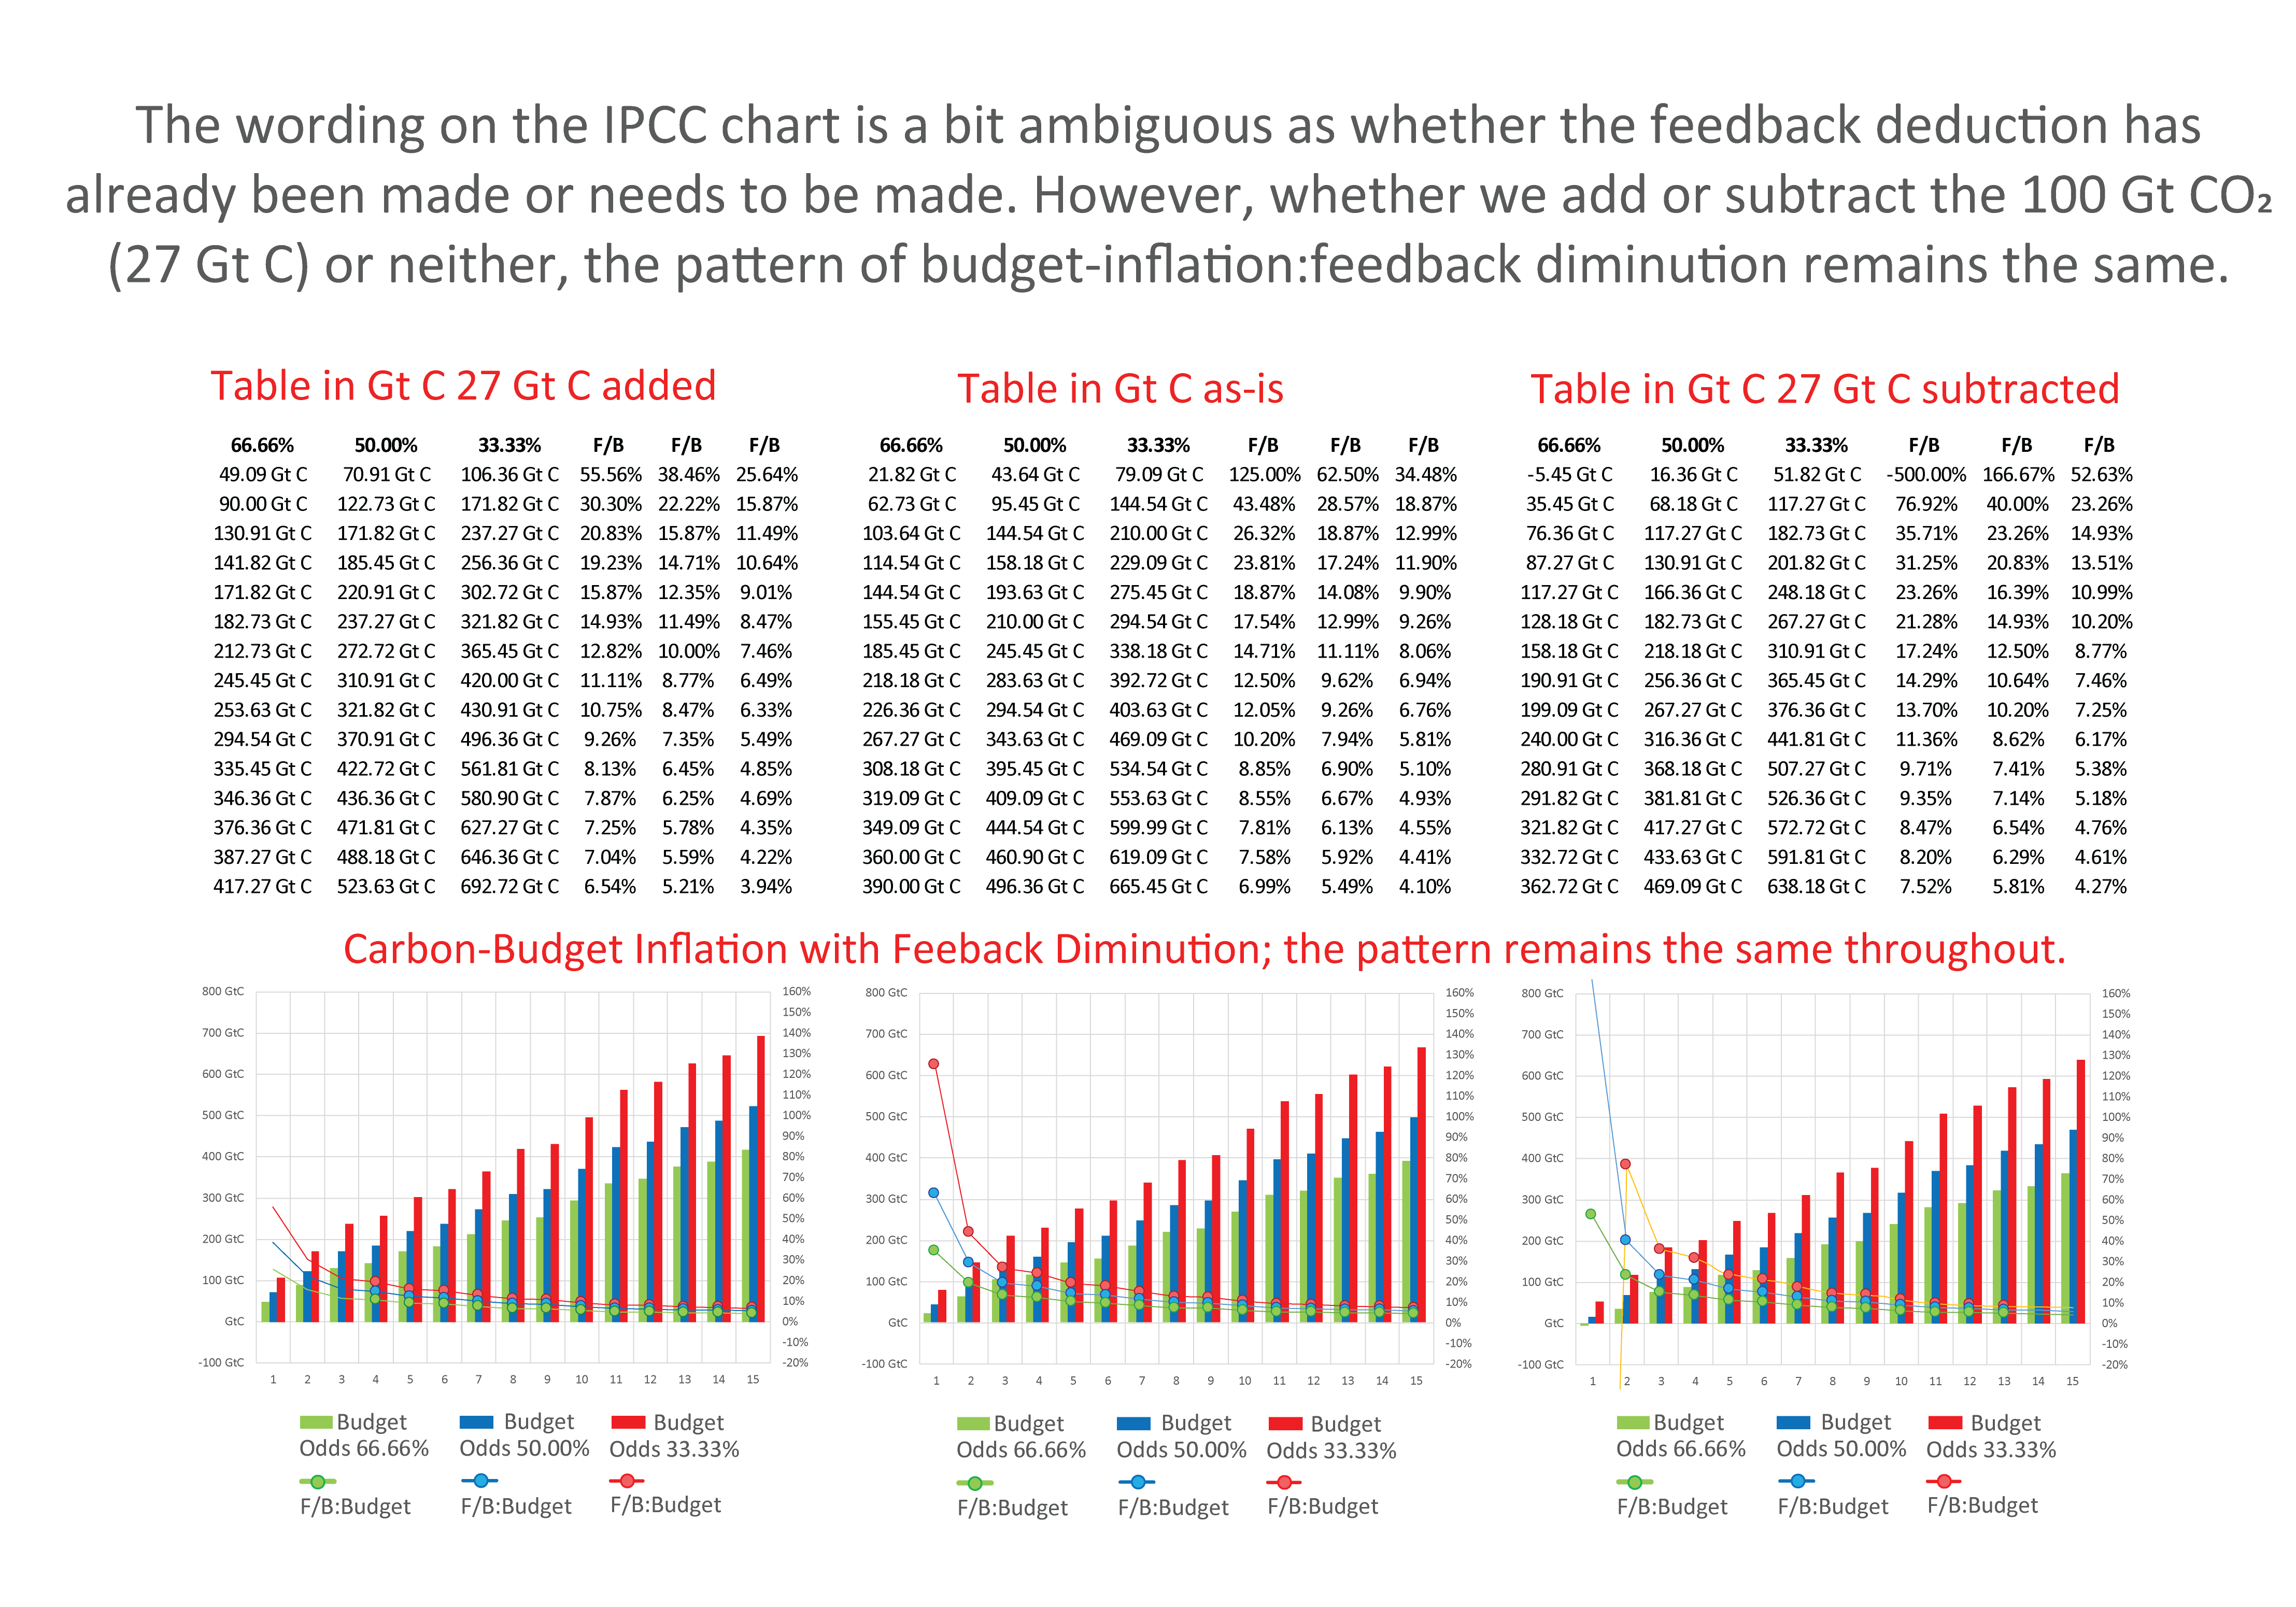
The wording in the original Table 2.2 regarding Earth System Feedbacks (ESF) is a bit ambiguous as to whether the 100 Gt CO2 deductions need to be made of have been made.
Here they are whether added or subtracted or neither. The main point remains the same, the patter of budget-inflation:feedback-diminution remains the same.
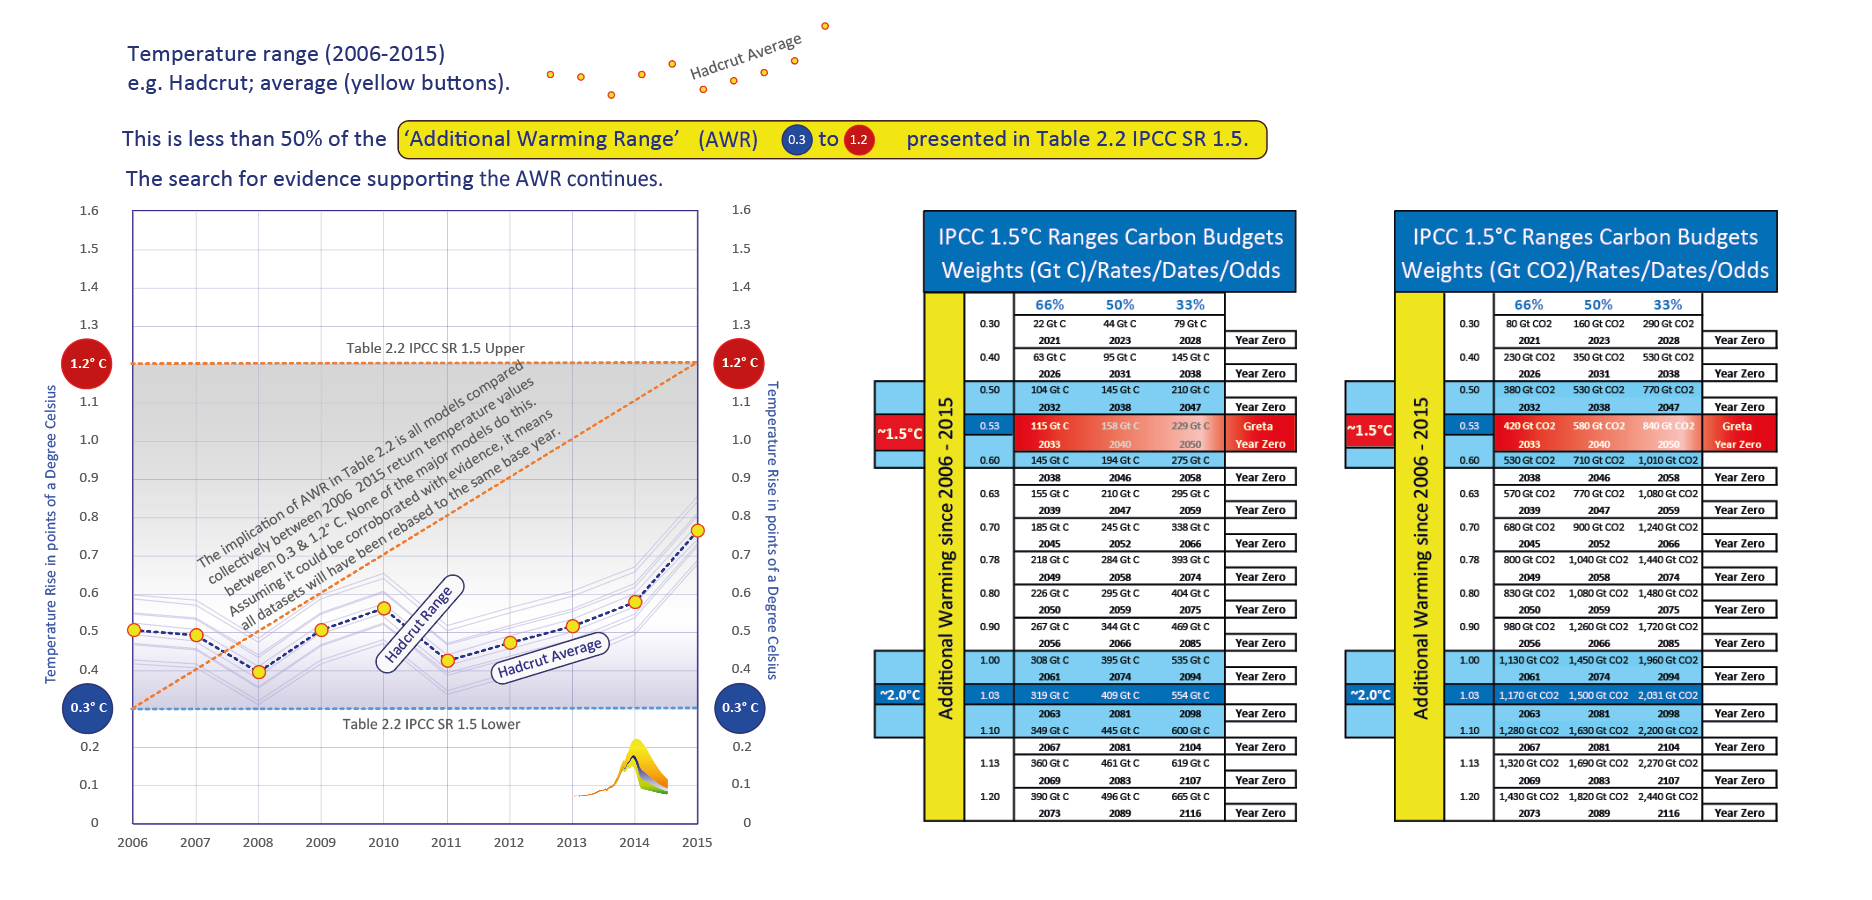
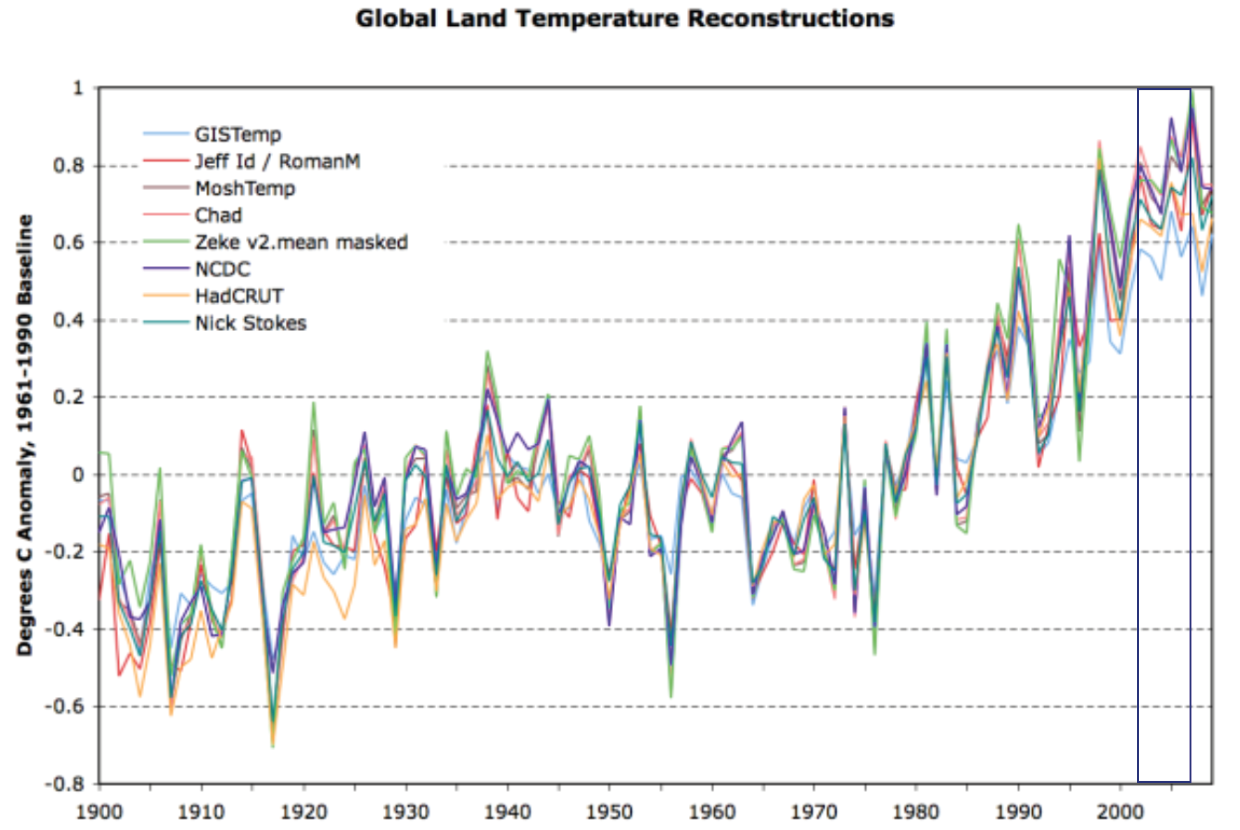
The 'Additional Warming Range' (AWR) in Table 2.2 (between 2006 & 2015) is genuinely puzzling.
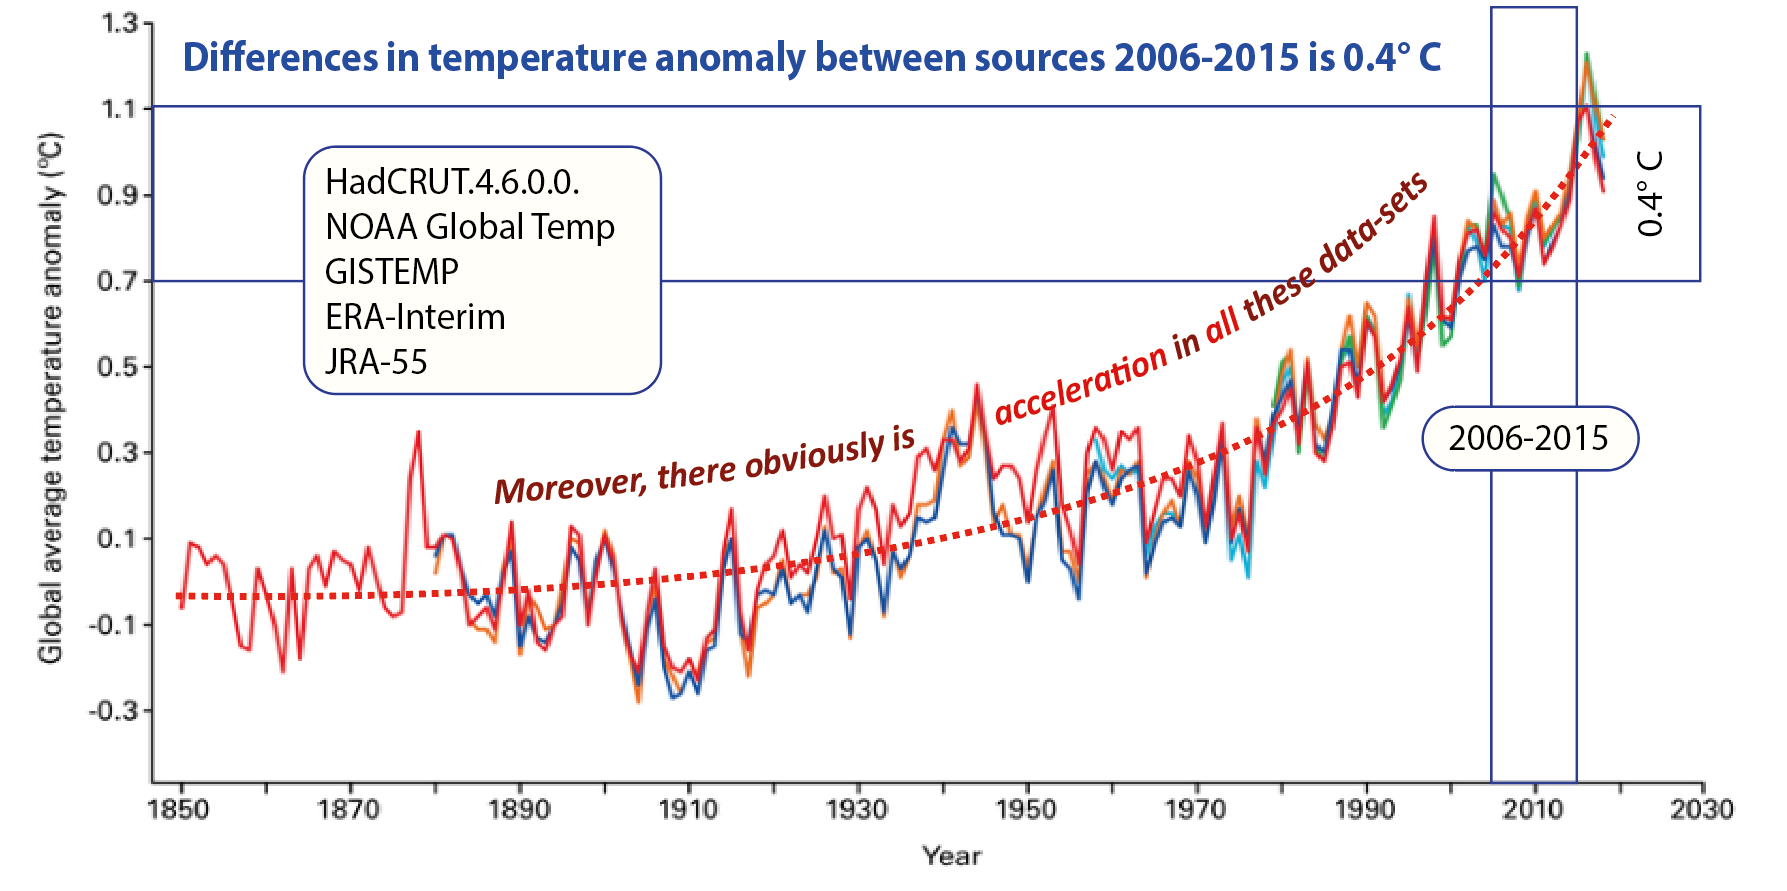
As shown here, it certainly doesn't concur with the Hadcrut data.
The search for evidence that supports the AWR continues.
However, even if after comparing data from all the models some supporting evidence is found,
the effect on the budget/odds calculations shown in Table 2.2 contradictory, as shown here.
In this interpretation the temperature range cover by the Hadcrut dataset is not more that 20% of the AWR.
In the next example we find that . . .
The implication of AWR in Table 2.2 is all models compared collectively between 2006 2015 return temperature values between 0.3 & 1.2° C.
None of the major models do this. Assuming it could be corroborated with evidence, it means all datasets will have been rebased to the same base year.
In this next interpretation the temperature range covered by the Hadcrut dataset is less than 50% of the AWR.
In the next example we find that . . .
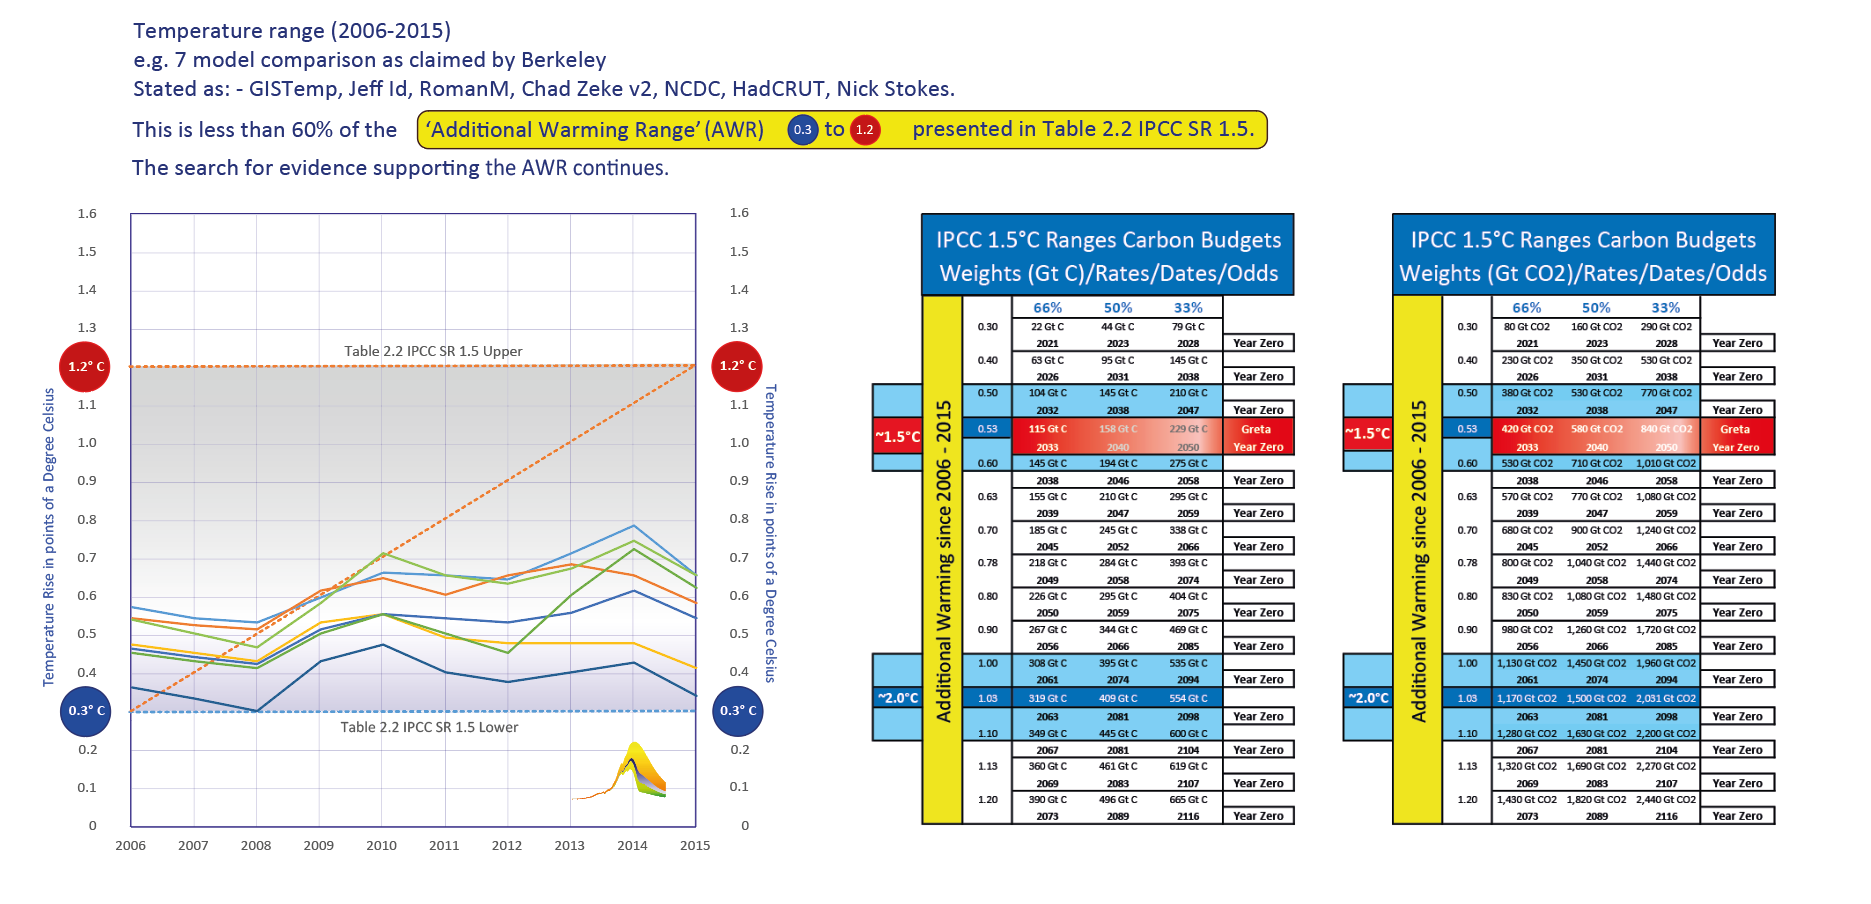
The implication of AWR in Table 2.2 is all models compared collectively between 2006 2015 return temperature values between 0.3 & 1.2° C.
Here is a comparison of models put forward by Berkely. In this interpretation the temperature range covered by the Berkely comparison of dataset is less than 60% of the AWR.
With the exceptions of GISS & Hadcrut (which as traced from their image, actually contradict GISS & HadCRUT), the remaining models as listed are unknown to this author.
This compilation of well-known models covers only about 0.4 of a degree (2006-2015) i.e. it doesn't qualify either.
Moreover, there is quite obviously average acceleration in all these data-sets.
