All these Business Leaders have cosigned a letter to Boris Johnson
http://www.gci.org.uk/Documents/Business_Groups_CEO_resilient_recovery_letter_June_2020.pdf
"As businesses & business groups operating in the UK, we reaffirm our commitment to action on
climate change and our determination to create a cleaner, competitive & inclusive UK economy.
The current crisis, in moving us all away from business-as-usual, has already created shifts in
how we operate, and we believe we must use the recovery to accelerate the transition to net zero.
Efforts to rescue and repair the economy in response to the current crisis can and should be
aligned with the UK’s legislated target of net zero emissions by 2050 at the latest."
A credible Road-map
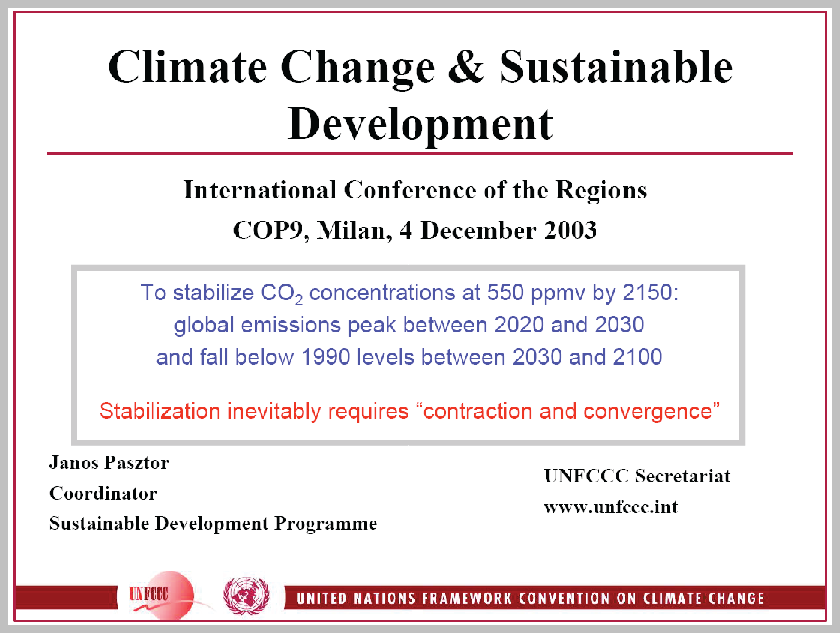
UNFCCC-Compliance, "inevitably requires contraction & convergence."
Introduced at COP-2 in 1996 and largely agreed at COP-3 in 1997,
this was publicly stated by the UNFCCC-Executive at COP-9
in 2004
In 2020, here is the global & international time-frame within which we all need to organize & act.
Carbon-Budgets here are time integrated so carbon-weights, descent-rates & zero dates are definite (not probable).
Support for this approach has grown extensively over the last 25 years.

- Calculating the weight-rate-date of a carbon-contraction budget is simple arithmetic
It gives not short-term or long-term, but full-term carbon-budget-certainty.
- CO2 concentrations are Constant Airborne Fraction (CAF) here 50% retained:50% returned to sinks
The CAF value is easily reset or put on a gradient to reflect decreasing sink-efficiency over time - again certainty.
- Atmospheric CO2 concentrations can be expressed as Parts Per Million by Volume (PPMV)
or as weight (conversion is 1 PPMV = 2,130,000,000 tonnes of Carbon Dioxide).
As Carbon Dioxide Information Analysis Centre (CDIAC) Oakridge Tennessee makes clear
Question: - In terms of mass, how much carbon does 1 part per million by volume (PPMV) of atmospheric CO2 represent?
Answer: - Using 5.137 x 10¹⁸ kg as the mass of the atmosphere (Trenberth, 1981 JGR 86:5238-46), 1 ppmv of CO2= 2.13 Gt of carbon
- PPMV expressed as weight, enables immediate quantitative comparison with the under-lying carbon budget
The conversion rate between carbon dioxide & carbon only is 3.6667:1
- The temperature acceleration allowing for Climate Sensitivity of ~ 5 degrees Celsius however has too many unknowns
in the growing + feedback dynamics to model with any certainty; here uncertainty is a direct function of the unknowns.
- The danger of uncertainty is that as the value of 'climate-sensitivity' increases, the
deceleration curvature following
PPM curvature gradually becomes acceleration curvature for the emerging rates of temperature increase.
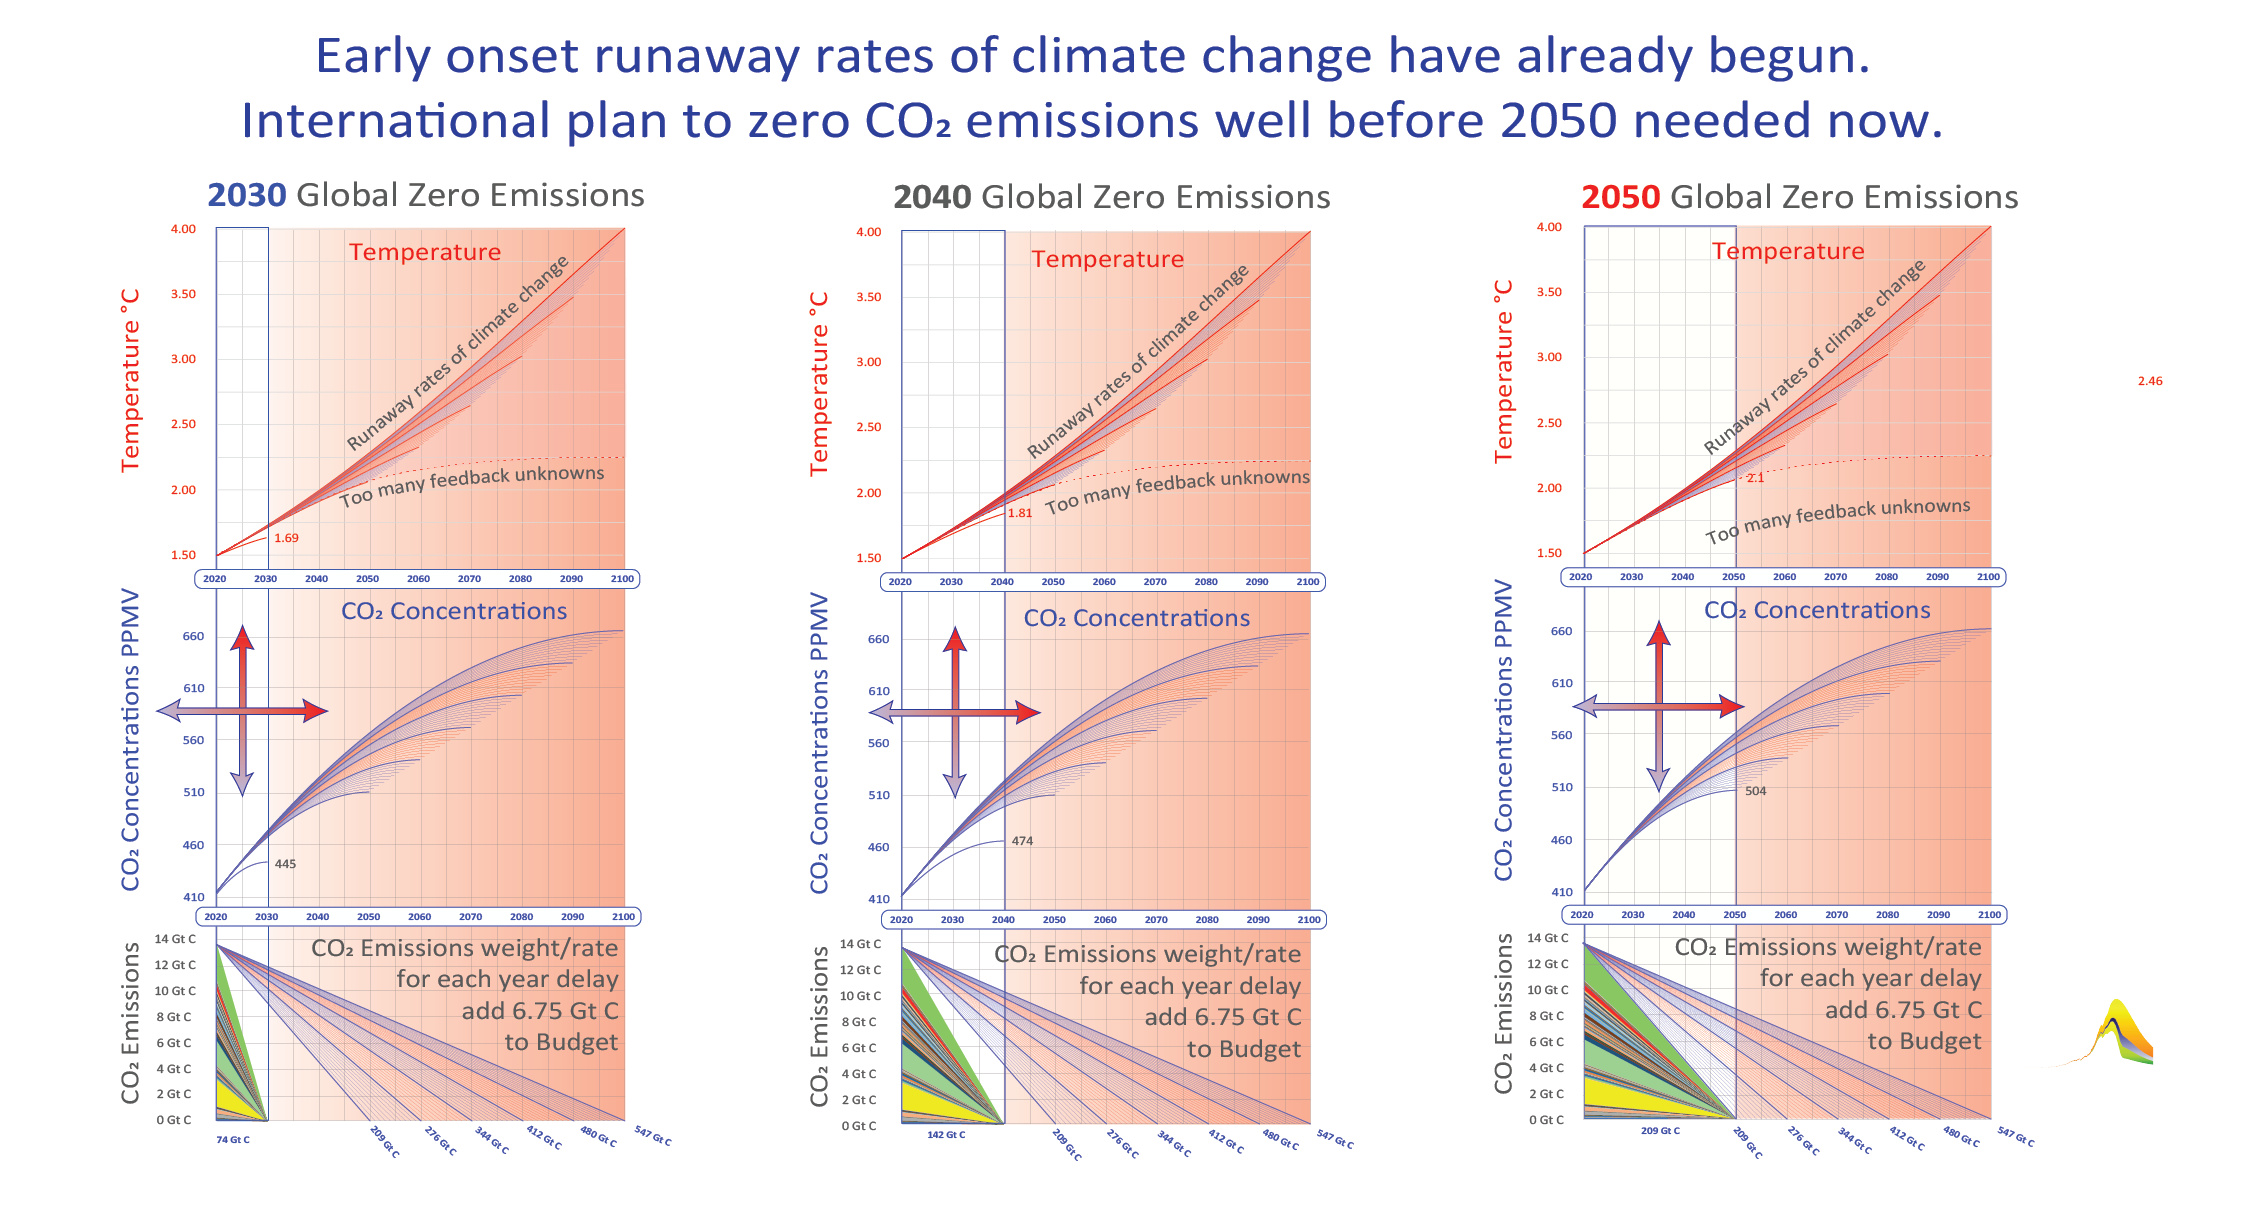
The three charts above are deliberately identical except for: -
Case 1 (left) shows an International Contraction & Convergence (C&C) event to zero by 2030
Case 2 (middle) shows an International Contraction & Convergence (C&C) event to zero by 2040
Case 3 (right) shows International Contraction & Convergence (C&C) event to zero by 2050
so clear case-comparisons can be made for
carbon budgets starting at 13.5 Billion tonnes of carbon in 2020.
Case 1 - to zero by 2030, integral weight 74 Billion Tonnes Carbon (Gt C), Flat rate annual reduction, 10.0 % of amount in 2020 per annum
Case 2 - to zero by 2040, integral weight 142 Billion Tonnes Carbon (Gt C), Flat rate annual reduction, 5.0 % of amount in 2020 per annum
Case 3 - to zero by 2050, integral weight 209 Billion Tonnes Carbon (Gt C), Flat rate annual reduction, 3.3 % of amount in 2020 per annum
In all cases, the highest budget integral weight shown is 547 Gt C & a Flat rate annual reduction of 1.25% of the amount in 2020 per annum
reaching zero in the year 2100.
concentrations starting at 414 PPMV (882 Gt CO2) in 2020
Case 1 - to 2030 at 445 PPMV ( 948 Gt C)
Case 2 - to 2040 at 474 PPMV (1,090 Gt C)
Case 3 - to 2050 at 504 PPMV (1,073 Gt C)
In all cases the highest curve, shown to the year 2100 is 670 PPMV (1,427 Gt C).
temperature starting at 1.5° in 2020 to
Case 1 - to 1.69° in 2030
Case 2 - to 1.81° in 2040
Case 3 - to 2.11° in 2050
- Two uncertainties around the strength of the temperature response are addressed within the time-frame to 2100.
1. + feedback sign ascribed to future high level cloud formation 2. the climate sensitivity value is raised to > 5° C.
- Internationally sharing these global carbon budgets, or C&C-events is simply referenced
to the global per capita average arising under each contraction weight-rate shown.
- In the example above, all country convergence on to the global average is immediate,
with a population base-year set for 2020.
- Key is that while the convergence rate can be slower, the global contraction total always
commutes with its internationally convergent parts, whatever the rate of convergence.
- In other words, the budget-integration of C&C makes it
the unit-of-measure (the 'numeraire') of UNFCCC-Compliance.
- Based on collective and inclusive human use of the global-commons, this is the only
non-random policy-basis
strategically
focused on UNFCCC-Compliance. Anything else is the probability distribution function of picking numbers out of a hat.
- Due to increasing feedback sign/strength, uncertainties regarding the rising temperature response to PPMV,
probability-density-function analysis will inevitably be employed to address these uncertainties.
- However, it is not at all scientific to reverse all the uncertainty
back onto inclusively
calculating global/international carbon budgets, as was done in Table 2.2 in IPCC SR 1.5 C .
- While there may be uncertainty in delivering them,
there is no uncertainty
in the C&C methodology for inclusively calculating & sharing them.
****************************
Sources
[a] CO2 Emissions, simple arithmetic; data GCP CDIAC.
[b] CO2 Concentrations, CAF 50%; data Scripps.
[c] Temperature, CS ~5°; data IPCC.
[a] & [b] = certainty [c] >uncertainty.
Contraction & Convergence data & Chart, GCI.
****************************
In summary, Carbon contraction is a full-term global event and Carbon Contraction & Convergence (C&C)
is a full-term International event that numerically commutes with (adds up to) the global-contraction-event.
The implications are simple. UNFCCC-Compliance is C&C by definition. The sooner we complete the C&C event, the less unsafe
we are going to be as delay increases uncertainty and danger as we become more locked into runaway rates of climate change.
GCI has publicly argued this case since COP-1 in 1995 & COP-2 in 1996, getting significant interntional agreement at COP-3 in 1997.
The UNFCCC Executive said at COP-9 in 2003, "(PPMV) stabilization inevitably requires C&C."
C&C corroboration has been extensively expressed as support for that
in addition to many peer-reviewed C&C publications over the years.
****************************

Note re Table 2.2 in IPCC SR 1.5 (2018)
To subject uncertain temperature outcomes to probability density functions (pdf) is not invalid. However,
carbon budgets are internationally-shared full-term global-events. To subject these to pdf as well is not valid.
This new IPCC procedure paints a future of unknownability where probabilities in 'science' depend on probabilities in 'policy'.
In the absence of a strategy with an international structure for UNFCCC-Compliance, what is the political motive for this?
It is like trying to put on lip-stick with a spray gun to spread the responsibility for the mess of yet more unhelpful lip-service.

