The Carbon Budget Analysis Tool (CBAT)
Click logo to return to 'CBAT-general-page'
Here are the four 'domains' of CBAT where domains 2, 3 & 4 automatically pick up the user-selected carbon-budget emissions in domain 1.
On opening, the default setting is the contraction rate of global emissions - the global 'carbon-budget' - in the UK Climate Act.
It is 'cognitive-mapping', so the CBAT-user can increase or decrease this 'carbon-budget' and separately, the potential for the consequential change rates arising: -
- 'Domain One' - 'Contraction & Concentrations', with response arrays of 'climate feedbacks' & 'climate-effects' (temperature, sea level rise and ocean acidifcation)
- 'Domain Two' - 'Contraction and Convergence' where regional shares converge on the international per capita average arising
- 'Domain Three' - 'Contraction and Conversion' exploring the interactive rate at which fossil fuel consumption needs to be replaced with renewable sources
- 'Domain Four' - 'Climate Damages and Growth' exploring the rate of the climate-damage curves arising from different rates of carbon contraction
A description of CBAT by Plan-B was published thereafter; a technical note is here; Appreciation is here.
*************************************************************************CBAT Domain Two - Contraction & Convergence (Click image to animate)
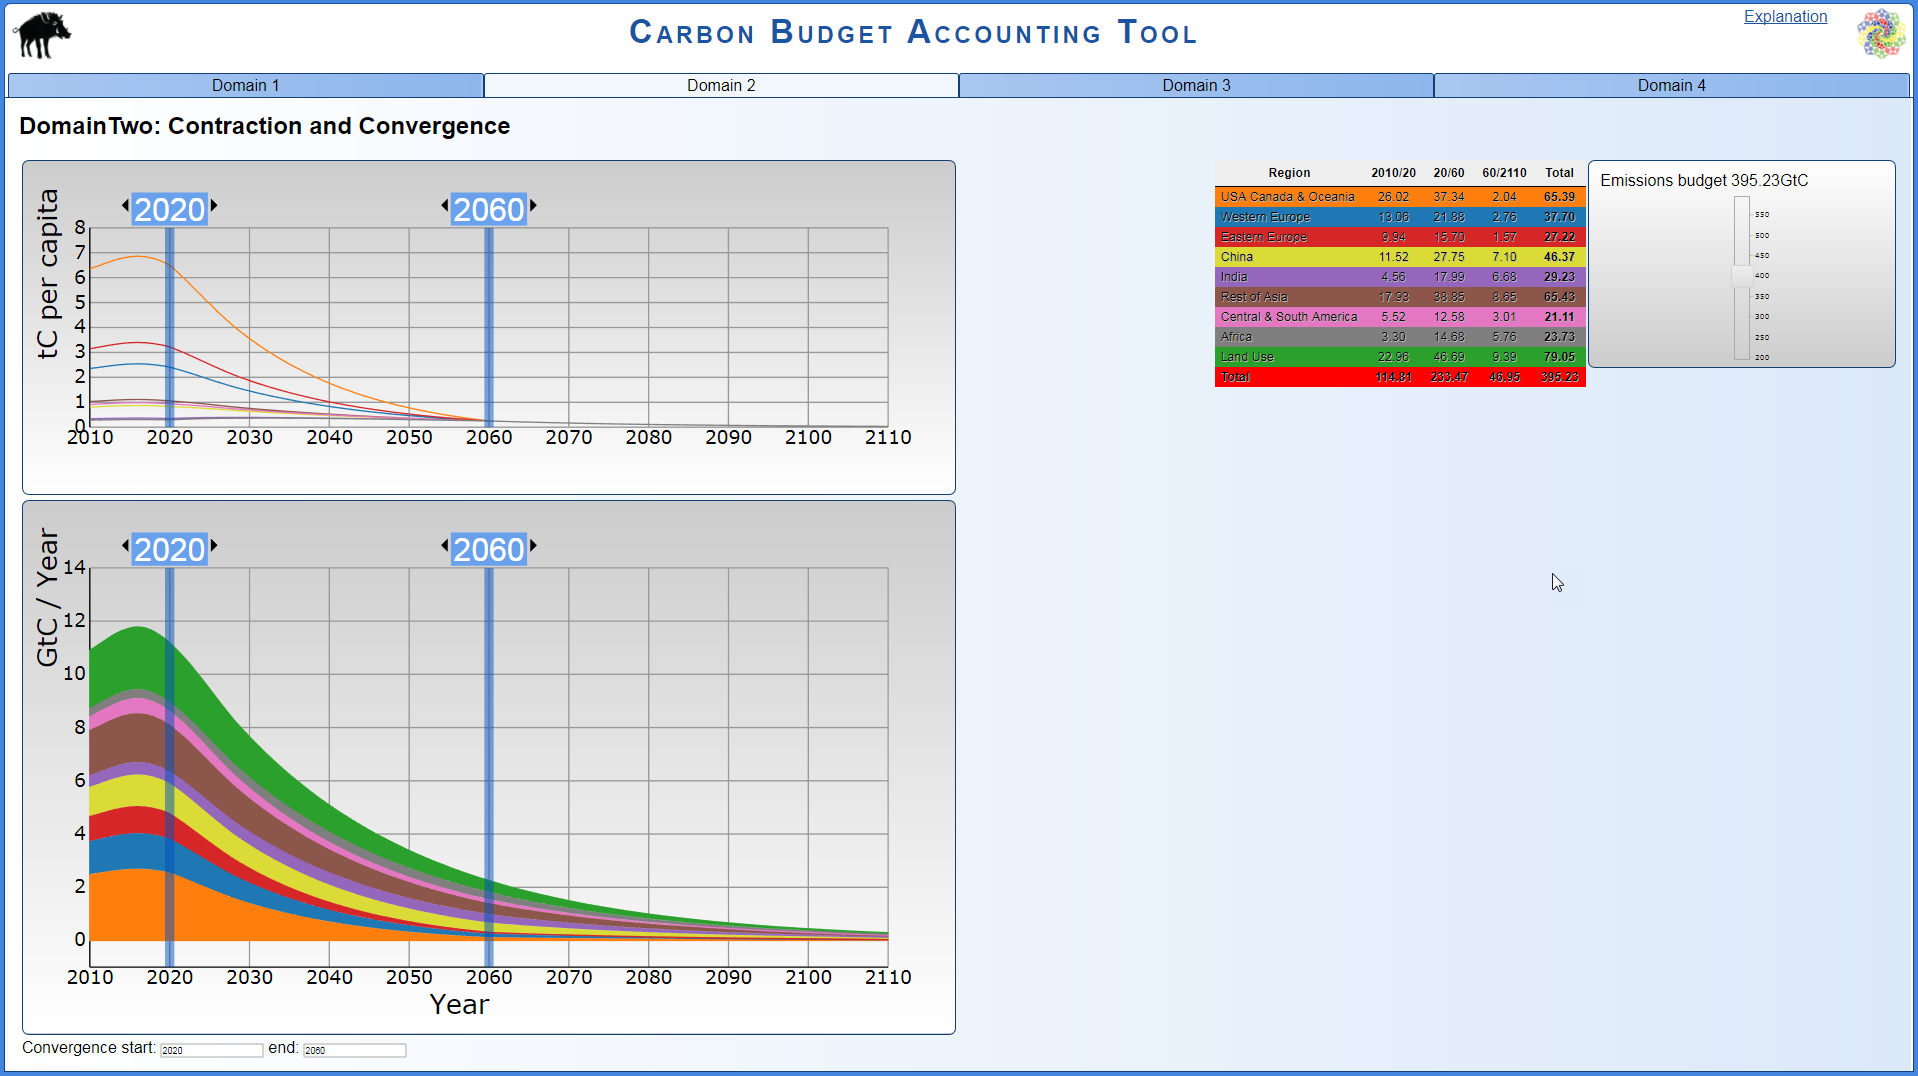
The size (integral-weight, rate and date) of the 'global carbon budget' in Domain 2 (as with all 4 CBAT Domains)
is the primary user control in this Domain. Use the slider in the panel top right-hand corner to vary the 'carbon-weight'.
The table alongside is dynamic. The number in the bottom right-hand cell, will always correspond with the carbon-weight chosen with the slider.
If a budget of 400 Gt C is chosen (see above the slider), the bottom right-hand cell of the table will also show 400Gt C and so on.
For both gross and per capita emissions, future global carbon budgets are regionally partitioned as: -
- The US, Canada and Oceania
- Western Europe
- Eastern Europe
- China
- India
- The Rest of Asia
- Central & South America
- Africa &
- Land Use Changes
Subordinated to that, the user-control for 'convergence' on the global per capita average of carbon consumption,
shown in the top chart, where the blue vertical sliders across both charts (per capita & gross) are draggable for
- the start date of convergence between 2010 and 2109
- the end date of convergence between 2011 and 2110
- subject to the start-date always preceding the end-date
- a constant population from base year 2010
- and subordinate to the gross budget weight/rate/date first selected
That said, 'Contraction and Convergence' rates are interactive so that: -
- the slower the carbon contraction rate the hgher the climate risk
- the faster the carbon contraction rate the lower the climate risk.
Subject to that, as developed country per capita emissions are higher than developing country emissions: -
- a slower/later convergence rate favours developed countries
- a faster/sooner convergence rate favours developing countries more
The table in the top right hand corner responds for all regions to all combinations of the user rates of C&C chosen.
*************************************************************************