CO2 SOURCES & Shrinking SINKS, the Direction of Travel & Possible CO2 'Feedback-Emissions'
Click logo to return to 'links-page'
.............................................................................................................................................................................................................................
Full animation, comparing RCP 8.5 including reduction in sink-efficienty with IEA fossil fuel demand projections here (2000-2100).
***********************************************************************
- A recent twist in this on-going story of measuring the rate of sink-failure is in this projection from Rockstrom et al: -
- The extent to which this scenario depends on BECCS is heroic in the extreme.
- Furthermore, the extent of negative emissions provided by LUC is half that needed to operate BECCS on this heroic scale.
- However, the most disturbing element here is the projection of 100% ocean sink-failure by 2100, while human emissions are brought down to zero.
- What is shown is a stacked chart showing that failure.
- Some contest this claiming what was intended was showing that BECCS+LUC was additional to (i.e. graphically 'above') the natural sinks, which actually get larger.
The source/sink questions raised above are examined in detail here
A particular aspect of puzzle is that one of the co-authors cited here is Malte Meinshausen, who was responsible for the spreadsheet
of RCP 8.5 where the rate of sink-failure projected while emissions and concentratrions rose was much much slower (see below).
***********************************************************************
These elements analysed 1. Sink Analysis & CAF
  2. The Direction of Travel
  3. Evidence of Positive Feedback Emissions?
***********************************************************************
There's one thing the UKMO & GCI agreed over the years - it was, on the record the definition of 'sink-efficiency'
In the light of the update below (04 02 2019) on changing 'sink-efficiency,
the issue is now if this is the trend, where is this going to end?
This loss of sink-efficiency was a projection in 2010 in RCP 8.5. A 'constant-airborne-fraction' of 42% goes to 52% in ~10 years!
Now it has happened & it is significant 'positive feedback'. Here's the full (& ludicrous) extent of what was projected in RCP 8.5.Why ludicrous? Well because this returns to equilibrium at over 1962 PPMV by 2250 because . . . . (!) . . .
The issues are: -
- For whose benefit did the climate modellers in UKMO/IPCC produce this extraordinary projection?
- Aside from the unflagged collapse of the sink-function, the RCP 8.5 scenario is 'feedback-free'.
- Why? Was it to maintain the pretence (or delusion) of 'human emissions control' at these levels.
Other questions arising are: -
- What function was in the 'climate-model' used in 2010 that projected these changes in the sink-function?
- Why was such a serious matter not even referred to in the official presentation of the RCPs by IPCC in 2015?
- Assuming it's still possible, what does it take in the 'real-world' to stop this running further out of control?
***************************************************************************
All future CO2 contraction-budgets (whatever the rate) raise concentration in the atmosphere and the oceans.
The faster/lighter/sooner the budget, the less this happens. The slower/heavier/later the budget, the more this happens.
CLICK on the image below
Doing this will animate the chart so the simple but deadly arithmetic of atmospheric CO2 and oceanic sink accumulation is revealed.
Oceanic CO2 concentration build-up with pH falling (increasing acidity).
***************************************************************************
INTRODUCTION
Climate models have tended so far to be 'Carbon Cycle' models. These have tracked carbon dioxide (CO2) 'fluxes' between 'sources & sinks' on the land, in the oceans & the atmosphere. Prior to 1750, these carbon fluxes were only 'biological' carbon and not 'fossil' carbon & also 'notionally' at equilibrium because atmospheric CO2 concentrations weren't rising during the 'Holocene'.
The burning of fossil carbon
(e.g. coal, oil & gas) with the start of the Industrial Revolution from 1750 onwards, showed that increasing amounts of mostly fossil CO2 source-emissions started accumulating in the global atmosphere and that the CO2 sinks on land and in the ocean started enlarging. A breakdown of each country's contribution to this total (1750 - 2014).
As rising CO2 concentration in the atmosphere gradually raised global temperature, Global Climate-Models (GCMs) were built on tracking this CO2 'flux' between sources & sinks & projecting a range of futures in which CO2 emissions continued in varying amounts with a range of assumptions about how the total and the flux within it would alter in response.
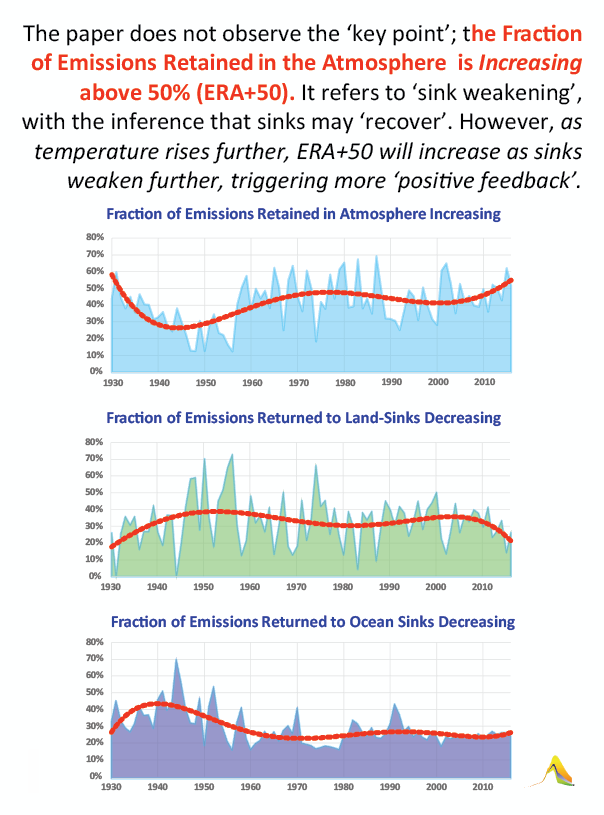
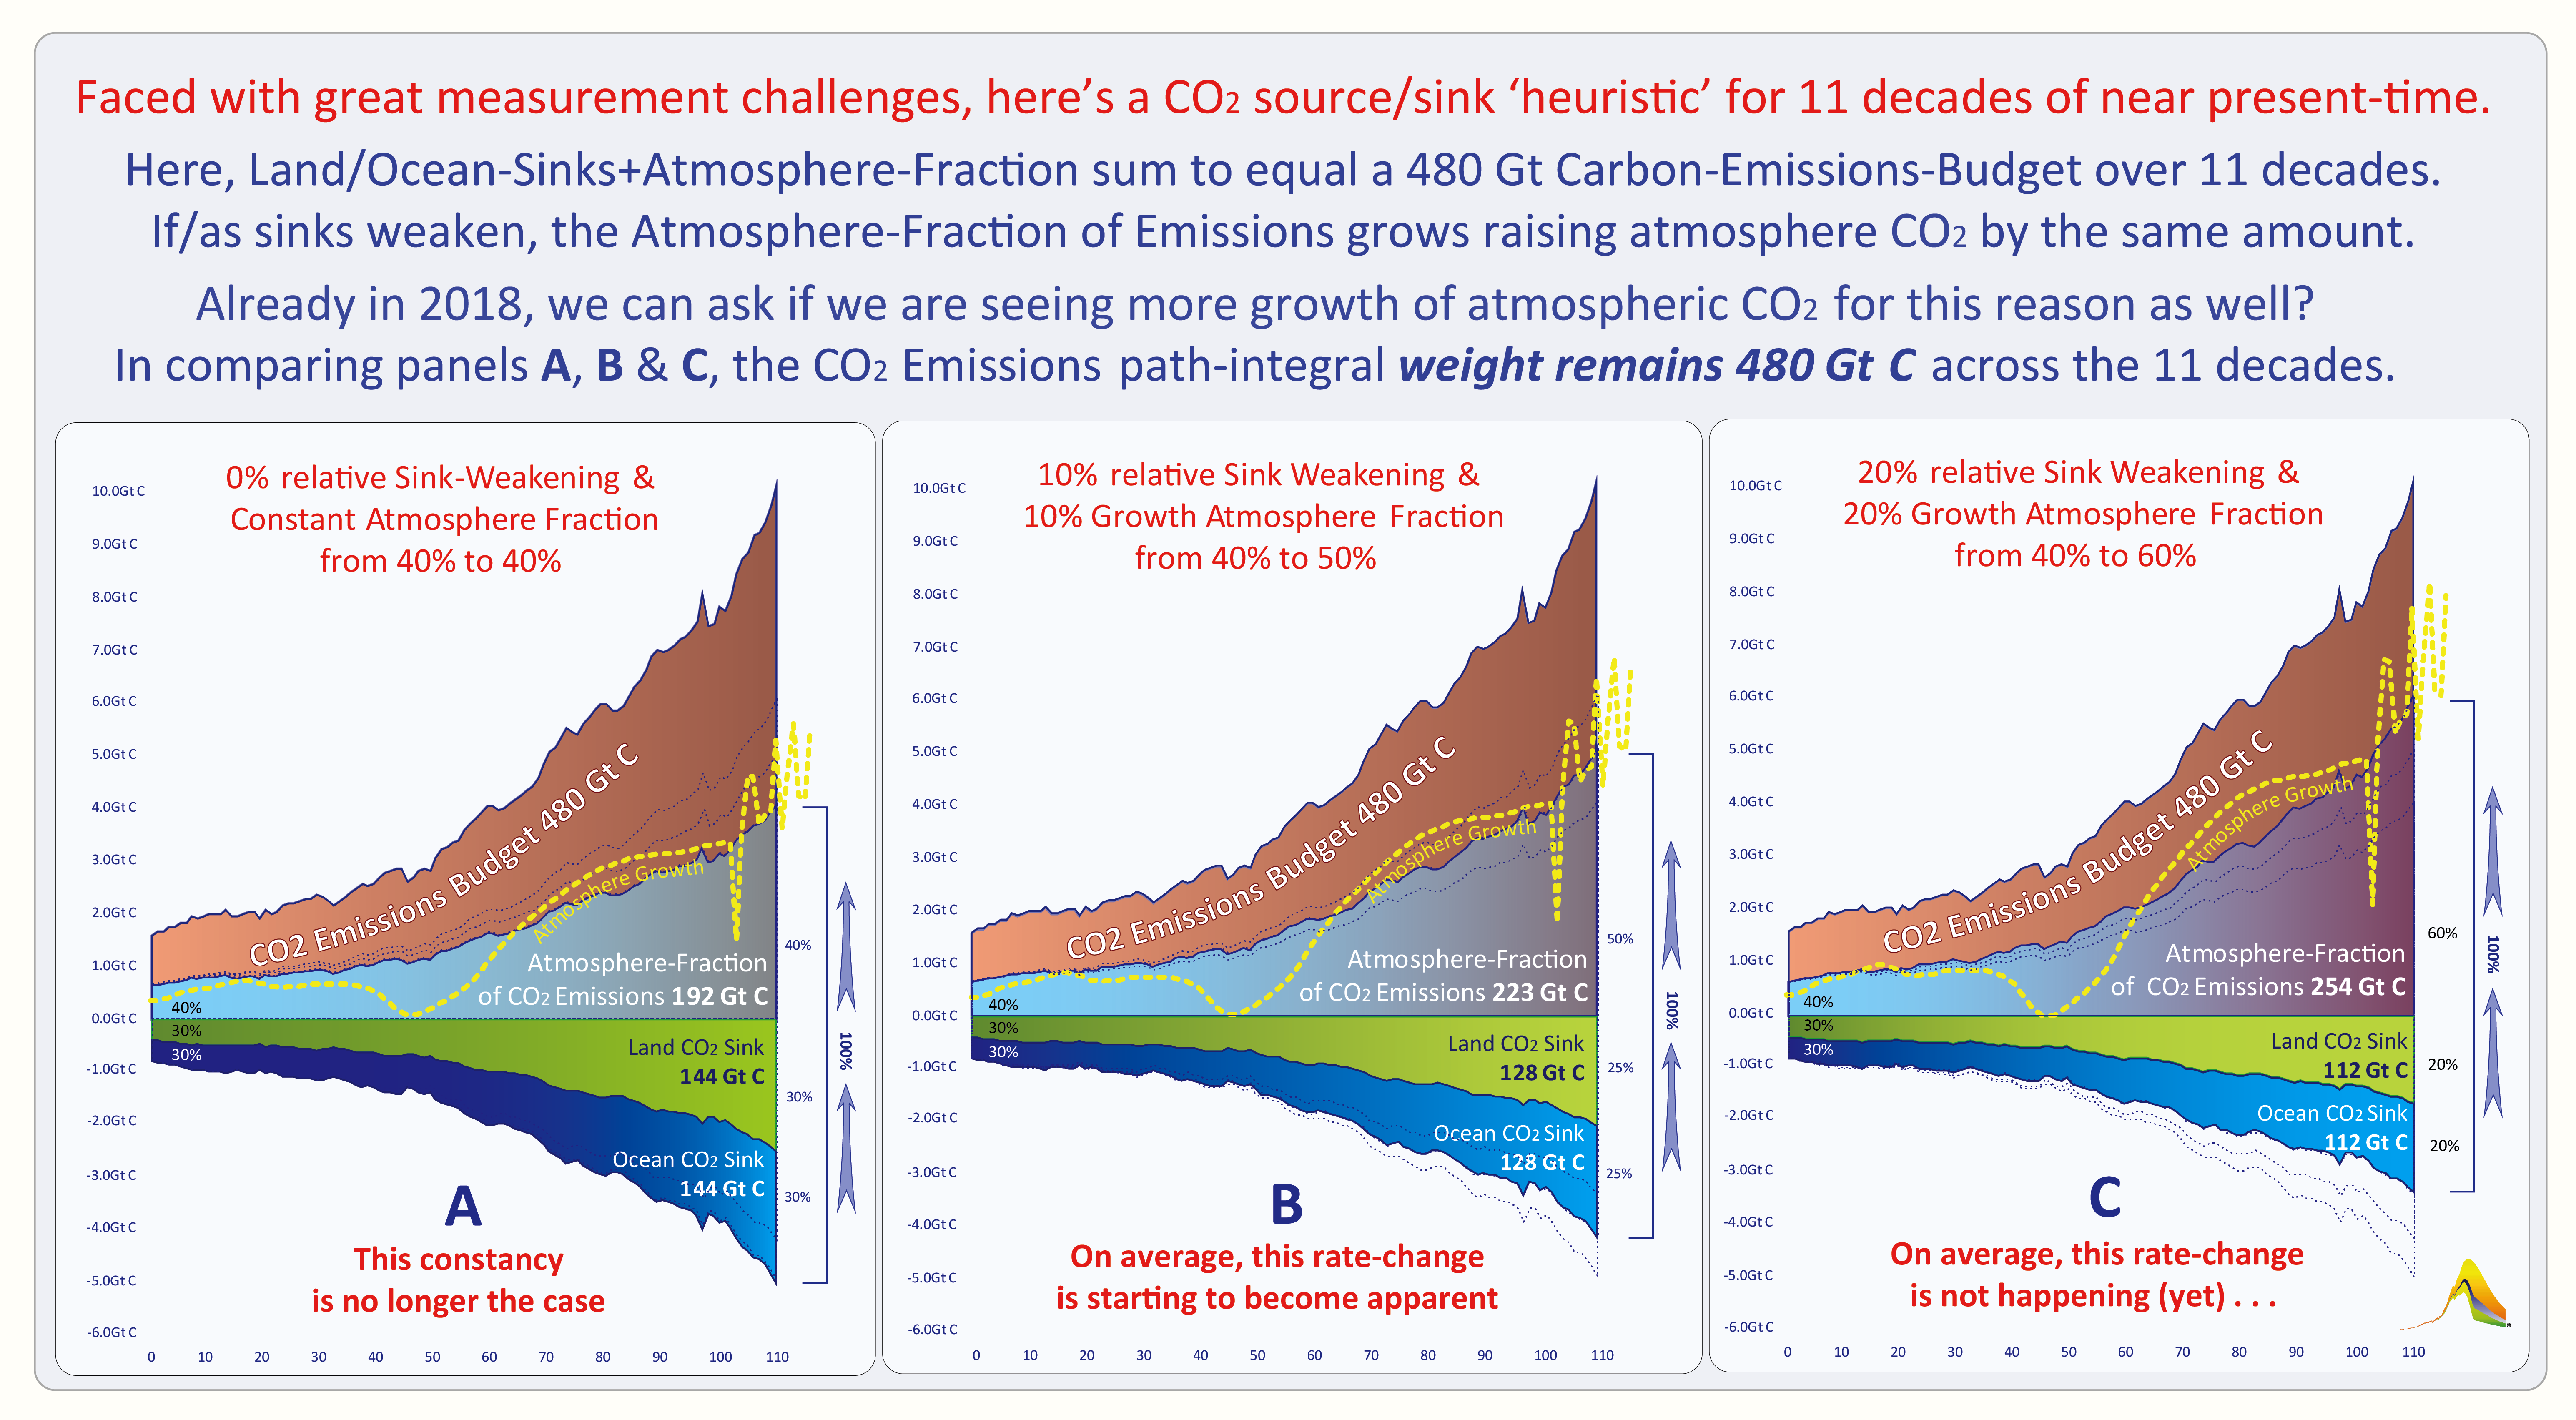
On average, the fraction of CO2 emissions accumulating in the atmosphere has been roughly constant (CAF) around 44%, raising concentrations from 280 PPMV in 1750 to around 410 PPMV in 2018. That's 130 PPMV, weighing ~277 Gt C or ~ 44% of emissions since 1740. The other 56% has gone in ~ equal measure to the enlarging land-sinks (23%) & enlarging ocean sinks (23%).
However, with fossil CO2 emissions continuing to rise & a global average warming now around 1°C since 1750, this source:sink flux is now changing.
The airborne fraction is rising above 50%. The fraction to the land-ocean sinks is decreasing to below 50%. At 3 minutes to midnight' as we approach climate tipping points, it means we do need to keep seeing the wood for the trees.
1. SINK ANALYSIS
A recent paper from the Global Carbon Project (GCP) shows this significant change in the proportions of the carbon flux.
In this web-comment, the term 'budget-emissions' means carbon we have deliberately chosen to burn from fossil fuel dependence & change in land use (LUC). We can conjecture that
these changes in the proportions of the carbon flux see us now being on a long-term course towards further weakening of the sink-function, if CO2 'budget-emissions' continue unabated.
2. DIRECTION of TRAVEL
The measurement challenges in this flux across time & space are considerable, but the direction of travel is clearly towards further weakening of the the sinks & this is very disturbing.
3. EVIDENCE of 'POSITIVE-FEEDBACK' EFFECTS? How near 'Midnight' are we?
However, there is a further dimension to this flux, namely the possibility of 'non-CO2-budget' secondary feedback emissions/effects now integrating with the calculations.
This is an almost impenetrable subject due to the measurement crisis increasing the number of known & unknown 'unknowns' involved in these yet more complex dynamics.
The ultimate issue here is keeping control versus the gradual loss of control. While 'budget-emissions' are at least potentially 'directly controllable', non-budget feedback emissions/effects
are not directly controllable. In the light of the need for compliance with the UNFCCC and the Paris Agreement, a cognitive mapping methodology for handling this is proposed here.
That said, the analysis that follows here led to the chart above.
It was triggered by the work on 'sink-measurement' collated & published by the Global Carbon Project (Copernicus).
What I did was to: -
- analyse the atmosphere/land-sink/ocean-sink chart or 'Net-Sink-Integral' on page 423 of the GCP article
- separate out and make clearer the decline in land/ocean-sinks opposite the increase in airborne fraction (CAF - charted above)
- note these three immediately obvious instances of sink-weaking: -
- as the forests warm (& here from climatereality) they will spotaneously burn more frequently and more fiercely, out-gassing over an extending area
- as the oceans acidfy (& here from UKOARP) from the increase in carbonic acid, so 'calcification' (carbon removal through shell-formation) will decrease
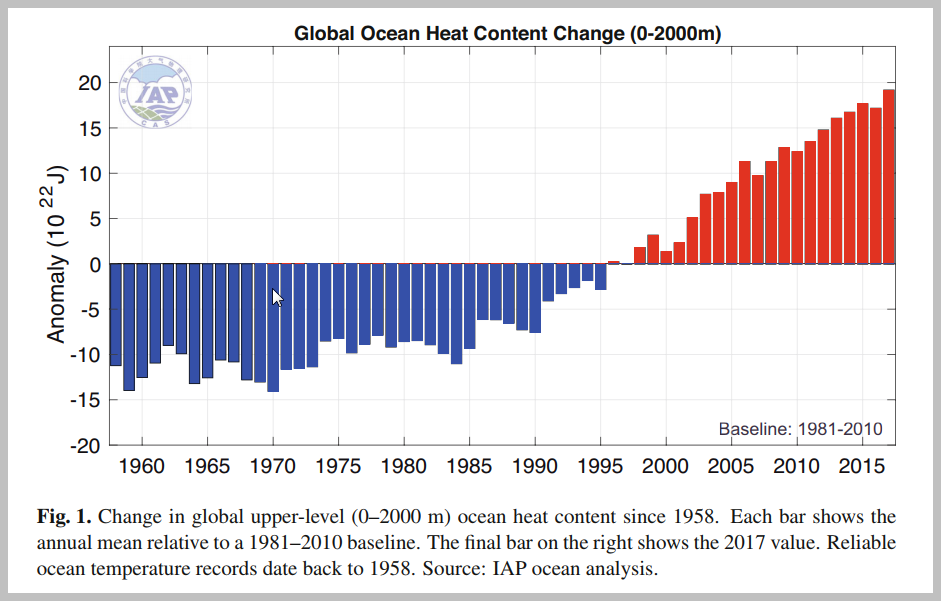
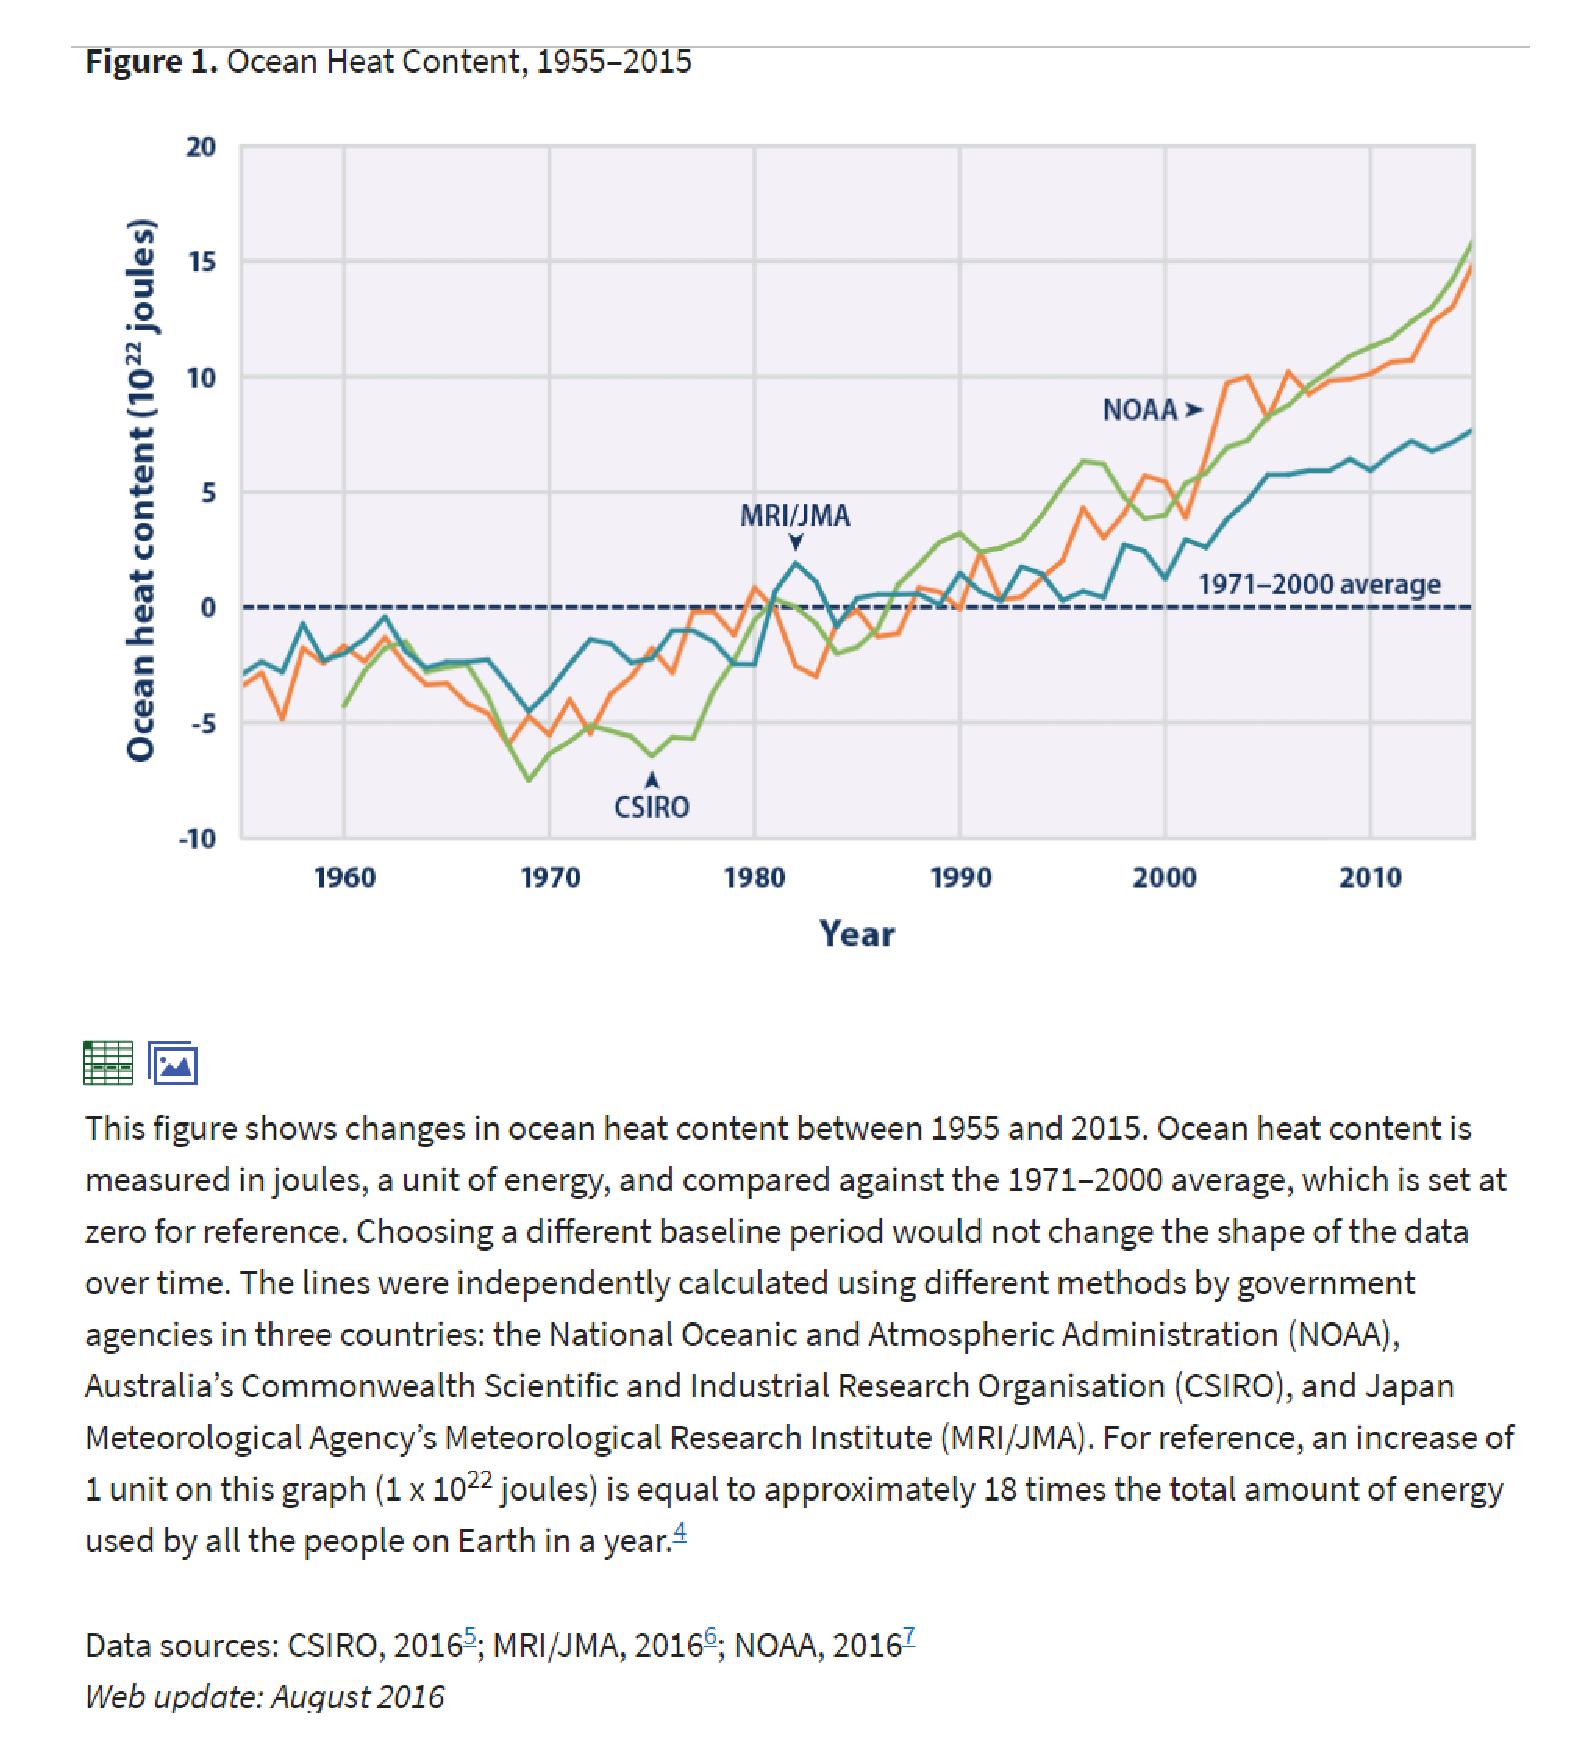
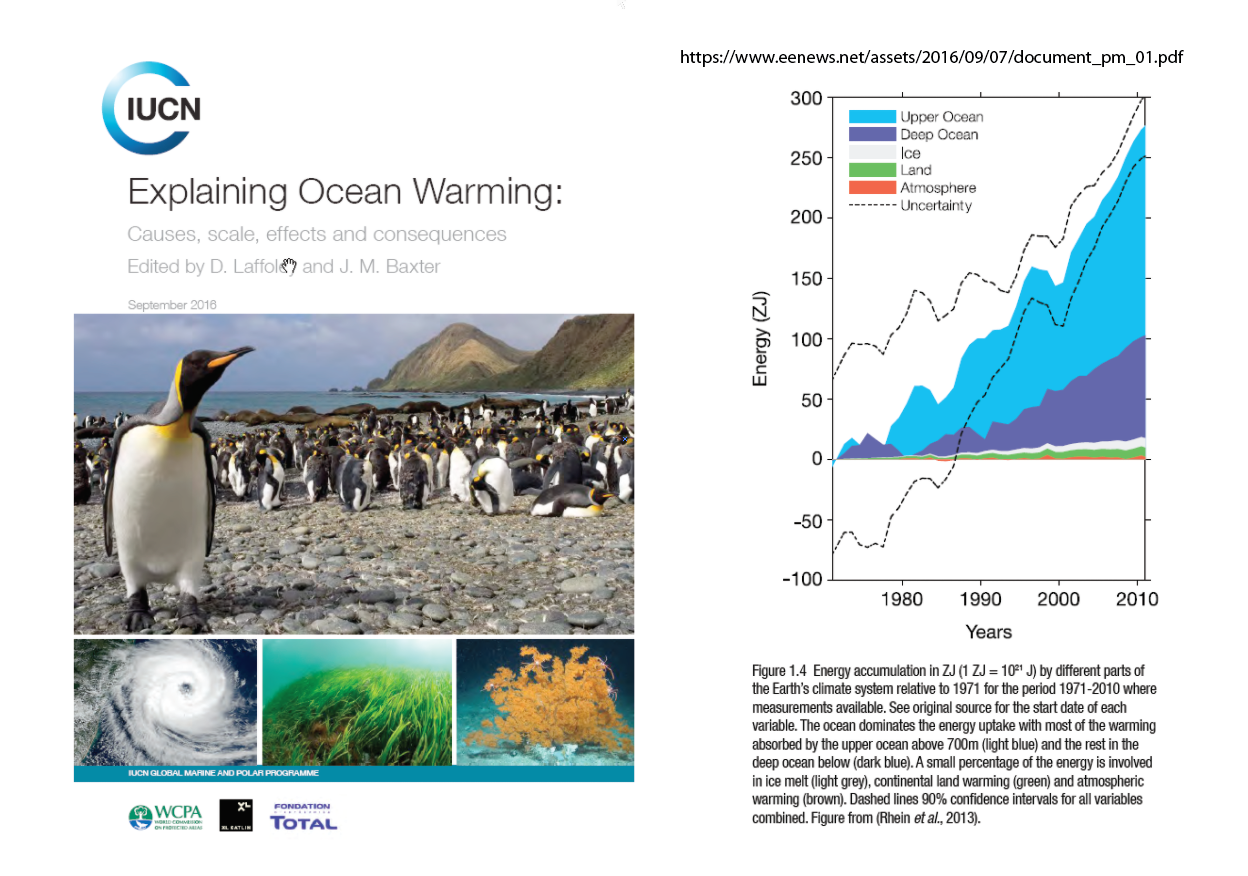
- as the oceans warm (& here from USEPA) (& here from IUCN; >90% of the heat increase) simple physics means they will absorb less carbon from the atmosphere
- I asked the main author of the GCP article why it did not make clear that CO2 retention in the atmosphere was now over 50% of the sink-integral?
- To which she replied, 'that important point was beyond the scope of the Journal' which published their article.
The observations & assumptions on which GCI investigated all this further, were that: -
- If the airborne fraction was increasing relative to the decline of land/ocean-sinks . . .
- It couldn't be that this source-sink integral could equal budget-emissions in 2016, as the GCP article/charted-analysis showed
- Also the set would be a bad fit (as they admitted in the article), being full of what they called, 'uncertainties' in measurement.
So I went and looked at the GCP spreadsheets and found out only that: -
- After seeing that their emissions and sink-dynamics were a bad fit . . .
- If I substituted the CDIAC fossil-fuel/LUC emissions data for the GCP fossil-fuel/LUC emissions data
- The mis-fit went down from 31 Gt C to just 0.6 Gt C
- & the most recent CDIAC emissions data went *above* the GCP sink-integral after 2003
- i.e. indicative of 'non-budget' or secondary 'feedback-emissions' - see yellow segment in the chart and
that showing this rise in emissions above the 'Net-Sink-Integral', which is a very big issue . . . .
Not perfect proof of 'measurable feedback-emissions' I grant you, but this 'correction-procedure' is a little less arbitrary than the results from GCP
as they stand. If it is therefore less incorrect than the GCP procedure, the minute hand on the climate-clock could be nearer midnight than we thought.
It is worth noting that this issue of sink-weakening is a CO2 'feedback effect', which is distinct from CO2 'feedback emissions' from melting Permafrost for example.
RCP 8.5 corroborates GCP sink-analysis
Measurement challenges . . . .
Where do the GCI Land Use Change (LUC) emissions data come from?
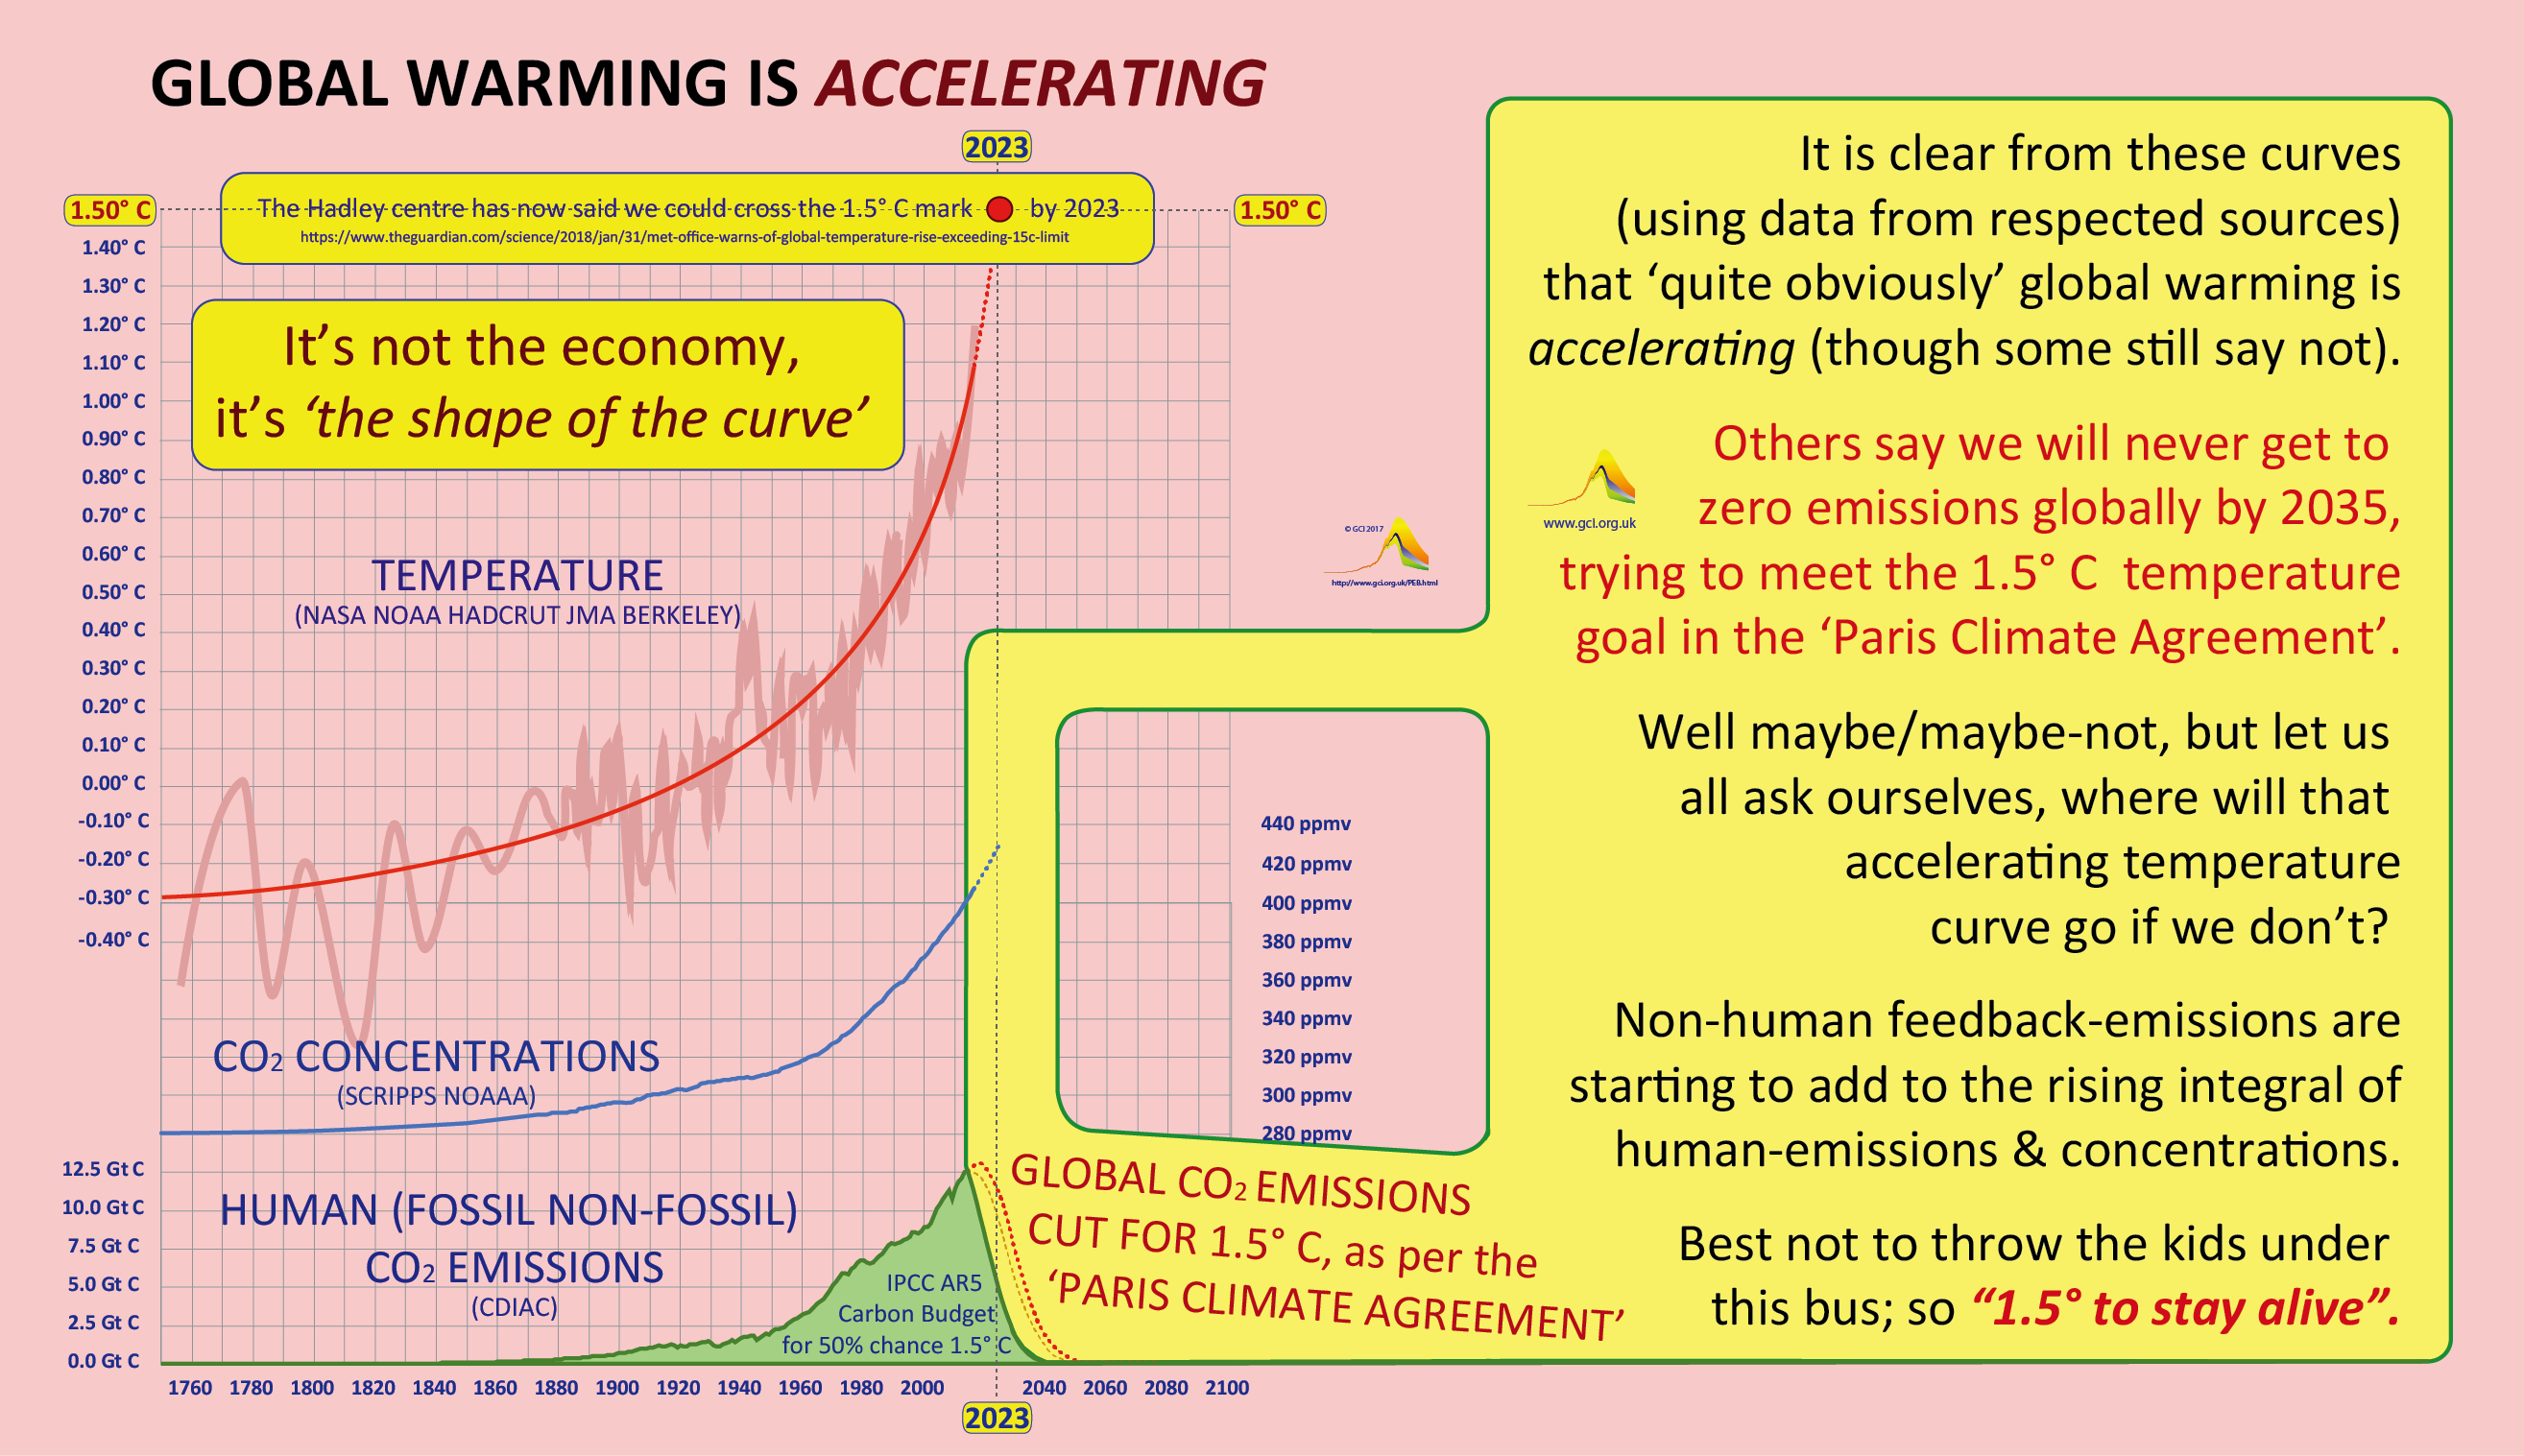
Finally, it is worth putting this in context of the present acceleration curvature of CO2 emissions, concentrations & temperature rise: -
.............................................................................................................................................................................................................................