Since 1990 GCI has well-tempered the focus on UNFCCC-Compliance with C&C
CO2 Budget-Emissions:Concentrations:Temperature:Growth_Minus_Climate-Damages
 Click logo to return to 'links-page'
MAIN MESSAGE
Zero Emissions Globally needs to have completed by 2040 or sooner, as the risks
runaway rates of climate change from zeroing emissions later are much too high.
The numeraire of precautionary-policy is constant in time space. It is not money which leads us
into a market-based-framework. For UNFCCC-Compliance a framework-based-market is required.
The IMF warns again that the climate-crisis will collapse the financial system.
"The broad consensus in the literature is that expected damages caused by unmitigated climate change
will be high and the probability of catastrophic tail-risk events is non-negligible."
We now need a War Footing to secure an Alliance for UNFCCC-Compliance
Global emissions zero by 2040 2030
*********************************
Work in progress
This page is 'work-in-progress'.
It contains full-disclosure of the . . .
- data-sources &
- calculating methodology behind this animation.
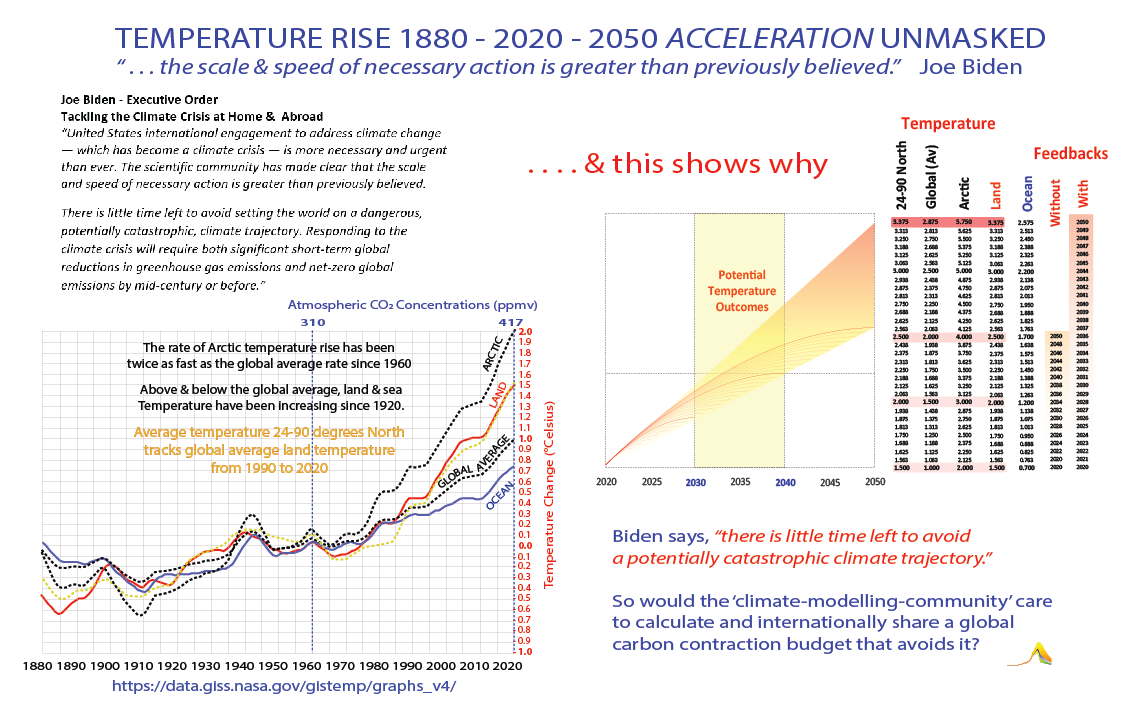
The data comes from GISS which charted temperature rise 1880-2020 giving the initial temperature values in 2020
for the averages 1. Globally 2. over land 3. in the ocean 4. the Arctic & 5. 24-90 degrees North.
The animation shows values 2020 to 2050 & how these will respond in the future . . .
Insurers have advised a Precautionary Policy since COP-6 2000
UNFCCC-Compliance is dependent on and Integrated Precautionary Policy framework
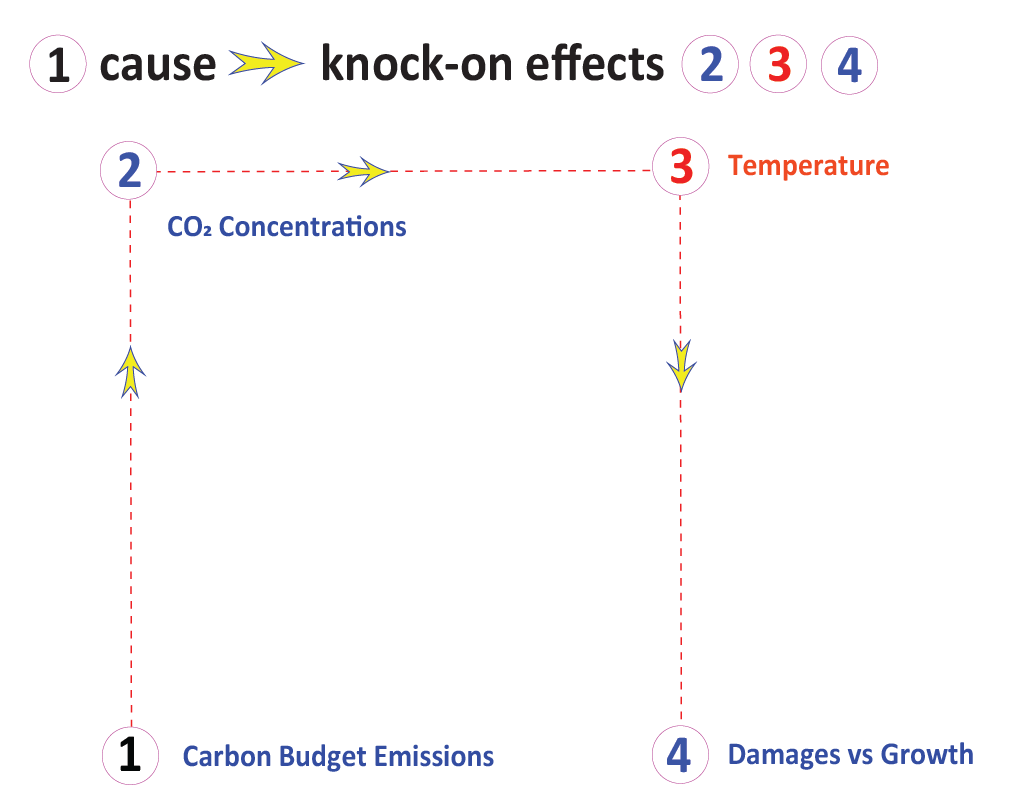
and this is dependent on applying a simple sequence of calcuating in this order: -
1. The Global Carbon Emissions 'Contraction-Budget' size (Integral-Weight, Contraction-Rate, Zero-Date)
2. The Atmospheric CO2 Rise-Response to these, taking account of changes in the airborne fraction of emissions.
3. The Temperature Rise-Reponse to these, taking account as best we can of a range and variety of feedback effects.
4. The rising Damage Costs caused by Temperature-Rise (as both insured and uninsured losses) subtracted from Economic Growth.
- In other words the primary control factor we still have is sizing the Contraction-Budget.
DATA
Global average temperature is misleading. There are differences between averages over land and over ocean.
There are also differences between averages at the equator and 'colder' latitudes North & South of the Tropics at the equator.
GISS datasets include these too. The global average 24° to 90° North equals the land average globally, as 70% of landmass globally
is North of the equator. These differences are now reflected in the chart above and will shortly be reflected in the animation.
The animation movie so far is below . . .
The final version will include commentary & voice-over. .
Step One
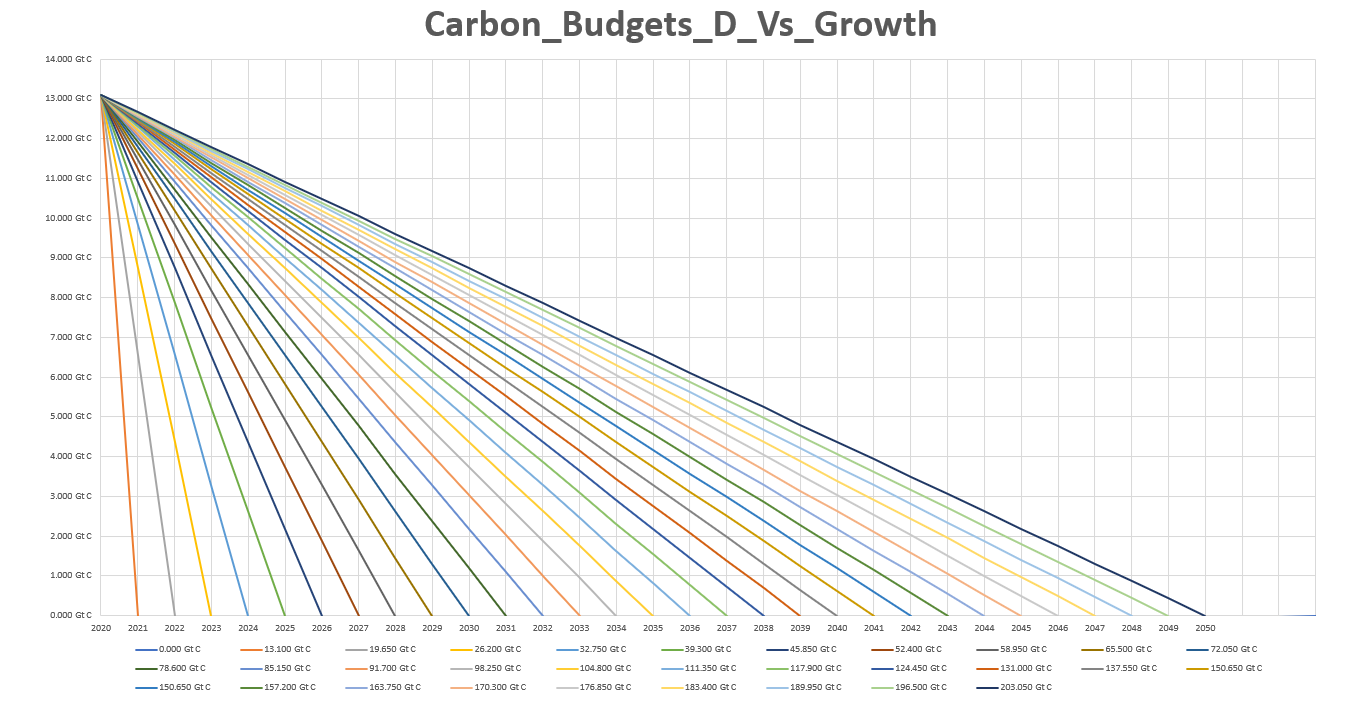
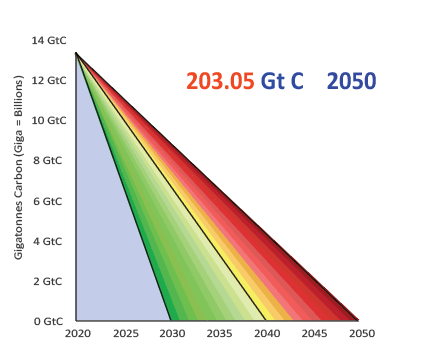
Calculate weight-range & contraction rates/dates of carbon-emission contraction-integrals in yearly steps between 2020 & 2050.
Here are the slides one-by-one
The rule is halving-the-contraction-rate doubles-the-budget-weight, or halving-the-budget-weight doubles-the-contraction-rate.
In the table below are the numbers that generate the chart above, showing also the annual contraction rates for each budget,
where the annual contraction rate for a global-carbon-contraction-budget (measured in Gt C) starting in: -
2021 that reaches zero by 2030 is minus increments of 10% of the total budget (for those years) each year weighing a total of 72 Gt C;
2031 that reaches zero by 2040 is minus increments of 5% of the total budget (for those years) each year weighing a total of 144 Gt C.
Total-weights dates & rates are shown in the bottom three rows of this table.
2020 13.100 Gt C 13.100 Gt C 13.100 Gt C 13.100 Gt C 13.100 Gt C 13.100 Gt C 13.100 Gt C 13.100 Gt C 13.100 Gt C 13.100 Gt C 13.100 Gt C 13.100 Gt C 13.100 Gt C 13.100 Gt C 13.100 Gt C 13.100 Gt C 13.100 Gt C 13.100 Gt C 13.100 Gt C 13.100 Gt C 13.100 Gt C 13.100 Gt C 13.100 Gt C 13.100 Gt C 13.100 Gt C 13.100 Gt C 13.100 Gt C 13.100 Gt C 13.100 Gt C 13.100 Gt C 13.100 Gt C 2021 0.000 Gt C 6.550 Gt C 8.733 Gt C 9.825 Gt C 10.480 Gt C 10.917 Gt C 11.229 Gt C 11.463 Gt C 11.644 Gt C 11.790 Gt C 11.909 Gt C 12.008 Gt C 12.092 Gt C 12.164 Gt C 12.227 Gt C 12.281 Gt C 12.329 Gt C 12.372 Gt C 12.411 Gt C 12.445 Gt C 12.476 Gt C 12.505 Gt C 12.530 Gt C 12.554 Gt C 12.576 Gt C 12.596 Gt C 12.615 Gt C 12.632 Gt C 12.648 Gt C 12.663 Gt C 2022 0.000 Gt C 4.367 Gt C 6.550 Gt C 7.860 Gt C 8.733 Gt C 9.357 Gt C 9.825 Gt C 10.189 Gt C 10.480 Gt C 10.718 Gt C 10.917 Gt C 11.085 Gt C 11.229 Gt C 11.353 Gt C 11.463 Gt C 11.559 Gt C 11.644 Gt C 11.721 Gt C 11.790 Gt C 11.852 Gt C 11.909 Gt C 11.961 Gt C 12.008 Gt C 12.052 Gt C 12.092 Gt C 12.130 Gt C 12.164 Gt C 12.197 Gt C 12.227 Gt C 2023 0.000 Gt C 3.275 Gt C 5.240 Gt C 6.550 Gt C 7.486 Gt C 8.188 Gt C 8.733 Gt C 9.170 Gt C 9.527 Gt C 9.825 Gt C 10.077 Gt C 10.293 Gt C 10.480 Gt C 10.644 Gt C 10.788 Gt C 10.917 Gt C 11.032 Gt C 11.135 Gt C 11.229 Gt C 11.314 Gt C 11.391 Gt C 11.463 Gt C 11.528 Gt C 11.588 Gt C 11.644 Gt C 11.696 Gt C 11.745 Gt C 11.790 Gt C 2024 0.000 Gt C 2.620 Gt C 4.367 Gt C 5.614 Gt C 6.550 Gt C 7.278 Gt C 7.860 Gt C 8.336 Gt C 8.733 Gt C 9.069 Gt C 9.357 Gt C 9.607 Gt C 9.825 Gt C 10.018 Gt C 10.189 Gt C 10.342 Gt C 10.480 Gt C 10.605 Gt C 10.718 Gt C 10.822 Gt C 10.917 Gt C 11.004 Gt C 11.085 Gt C 11.159 Gt C 11.229 Gt C 11.293 Gt C 11.353 Gt C 2025 0.000 Gt C 2.183 Gt C 3.743 Gt C 4.913 Gt C 5.822 Gt C 6.550 Gt C 7.145 Gt C 7.642 Gt C 8.062 Gt C 8.421 Gt C 8.733 Gt C 9.006 Gt C 9.247 Gt C 9.461 Gt C 9.653 Gt C 9.825 Gt C 9.981 Gt C 10.123 Gt C 10.252 Gt C 10.371 Gt C 10.480 Gt C 10.581 Gt C 10.674 Gt C 10.761 Gt C 10.841 Gt C 10.917 Gt C 2026 0.000 Gt C 1.871 Gt C 3.275 Gt C 4.367 Gt C 5.240 Gt C 5.955 Gt C 6.550 Gt C 7.054 Gt C 7.486 Gt C 7.860 Gt C 8.188 Gt C 8.476 Gt C 8.733 Gt C 8.963 Gt C 9.170 Gt C 9.357 Gt C 9.527 Gt C 9.683 Gt C 9.825 Gt C 9.956 Gt C 10.077 Gt C 10.189 Gt C 10.293 Gt C 10.390 Gt C 10.480 Gt C 2027 0.000 Gt C 1.638 Gt C 2.911 Gt C 3.930 Gt C 4.764 Gt C 5.458 Gt C 6.046 Gt C 6.550 Gt C 6.987 Gt C 7.369 Gt C 7.706 Gt C 8.006 Gt C 8.274 Gt C 8.515 Gt C 8.733 Gt C 8.932 Gt C 9.113 Gt C 9.279 Gt C 9.432 Gt C 9.573 Gt C 9.704 Gt C 9.825 Gt C 9.938 Gt C 10.043 Gt C 2028 0.000 Gt C 1.456 Gt C 2.620 Gt C 3.573 Gt C 4.367 Gt C 5.038 Gt C 5.614 Gt C 6.113 Gt C 6.550 Gt C 6.935 Gt C 7.278 Gt C 7.584 Gt C 7.860 Gt C 8.110 Gt C 8.336 Gt C 8.543 Gt C 8.733 Gt C 8.908 Gt C 9.069 Gt C 9.219 Gt C 9.357 Gt C 9.486 Gt C 9.607 Gt C 2029 0.000 Gt C 1.310 Gt C 2.382 Gt C 3.275 Gt C 4.031 Gt C 4.679 Gt C 5.240 Gt C 5.731 Gt C 6.165 Gt C 6.550 Gt C 6.895 Gt C 7.205 Gt C 7.486 Gt C 7.741 Gt C 7.974 Gt C 8.188 Gt C 8.384 Gt C 8.565 Gt C 8.733 Gt C 8.889 Gt C 9.034 Gt C 9.170 Gt C 2030 0.000 Gt C 1.191 Gt C 2.183 Gt C 3.023 Gt C 3.743 Gt C 4.367 Gt C 4.913 Gt C 5.394 Gt C 5.822 Gt C 6.205 Gt C 6.550 Gt C 6.862 Gt C 7.145 Gt C 7.404 Gt C 7.642 Gt C 7.860 Gt C 8.062 Gt C 8.248 Gt C 8.421 Gt C 8.583 Gt C 8.733 Gt C 2031 0.000 Gt C 1.092 Gt C 2.015 Gt C 2.807 Gt C 3.493 Gt C 4.094 Gt C 4.624 Gt C 5.094 Gt C 5.516 Gt C 5.895 Gt C 6.238 Gt C 6.550 Gt C 6.835 Gt C 7.096 Gt C 7.336 Gt C 7.558 Gt C 7.763 Gt C 7.954 Gt C 8.131 Gt C 8.297 Gt C 2032 0.000 Gt C 1.008 Gt C 1.871 Gt C 2.620 Gt C 3.275 Gt C 3.853 Gt C 4.367 Gt C 4.826 Gt C 5.240 Gt C 5.614 Gt C 5.955 Gt C 6.265 Gt C 6.550 Gt C 6.812 Gt C 7.054 Gt C 7.278 Gt C 7.486 Gt C 7.679 Gt C 7.860 Gt C 2033 0.000 Gt C 0.936 Gt C 1.747 Gt C 2.456 Gt C 3.082 Gt C 3.639 Gt C 4.137 Gt C 4.585 Gt C 4.990 Gt C 5.359 Gt C 5.696 Gt C 6.004 Gt C 6.288 Gt C 6.550 Gt C 6.793 Gt C 7.018 Gt C 7.228 Gt C 7.423 Gt C 2034 0.000 Gt C 0.873 Gt C 1.638 Gt C 2.312 Gt C 2.911 Gt C 3.447 Gt C 3.930 Gt C 4.367 Gt C 4.764 Gt C 5.126 Gt C 5.458 Gt C 5.764 Gt C 6.046 Gt C 6.307 Gt C 6.550 Gt C 6.776 Gt C 6.987 Gt C 2035 0.000 Gt C 0.819 Gt C 1.541 Gt C 2.183 Gt C 2.758 Gt C 3.275 Gt C 3.743 Gt C 4.168 Gt C 4.557 Gt C 4.913 Gt C 5.240 Gt C 5.542 Gt C 5.822 Gt C 6.082 Gt C 6.324 Gt C 6.550 Gt C 2036 0.000 Gt C 0.771 Gt C 1.456 Gt C 2.068 Gt C 2.620 Gt C 3.119 Gt C 3.573 Gt C 3.987 Gt C 4.367 Gt C 4.716 Gt C 5.038 Gt C 5.337 Gt C 5.614 Gt C 5.872 Gt C 6.113 Gt C 2037 0.000 Gt C 0.728 Gt C 1.379 Gt C 1.965 Gt C 2.495 Gt C 2.977 Gt C 3.417 Gt C 3.821 Gt C 4.192 Gt C 4.535 Gt C 4.852 Gt C 5.146 Gt C 5.421 Gt C 5.677 Gt C 2038 0.000 Gt C 0.689 Gt C 1.310 Gt C 1.871 Gt C 2.382 Gt C 2.848 Gt C 3.275 Gt C 3.668 Gt C 4.031 Gt C 4.367 Gt C 4.679 Gt C 4.969 Gt C 5.240 Gt C 2039 0.000 Gt C 0.655 Gt C 1.248 Gt C 1.786 Gt C 2.278 Gt C 2.729 Gt C 3.144 Gt C 3.527 Gt C 3.881 Gt C 4.211 Gt C 4.517 Gt C 4.803 Gt C 2040 0.000 Gt C 0.624 Gt C 1.191 Gt C 1.709 Gt C 2.183 Gt C 2.620 Gt C 3.023 Gt C 3.396 Gt C 3.743 Gt C 4.066 Gt C 4.367 Gt C 2041 0.000 Gt C 0.595 Gt C 1.139 Gt C 1.638 Gt C 2.096 Gt C 2.519 Gt C 2.911 Gt C 3.275 Gt C 3.614 Gt C 3.930 Gt C 2042 0.000 Gt C 0.570 Gt C 1.092 Gt C 1.572 Gt C 2.015 Gt C 2.426 Gt C 2.807 Gt C 3.162 Gt C 3.493 Gt C 2043 0.000 Gt C 0.546 Gt C 1.048 Gt C 1.512 Gt C 1.941 Gt C 2.339 Gt C 2.710 Gt C 3.057 Gt C 2044 0.000 Gt C 0.524 Gt C 1.008 Gt C 1.456 Gt C 1.871 Gt C 2.259 Gt C 2.620 Gt C 2045 0.000 Gt C 0.504 Gt C 0.970 Gt C 1.404 Gt C 1.807 Gt C 2.183 Gt C 2046 0.000 Gt C 0.485 Gt C 0.936 Gt C 1.355 Gt C 1.747 Gt C 2047 0.000 Gt C 0.468 Gt C 0.903 Gt C 1.310 Gt C 2048 0.000 Gt C 0.452 Gt C 0.873 Gt C 2049 0.000 Gt C 0.437 Gt C 2050 0.000 Gt C 0.00 Gt C 13.10 Gt C 19.65 Gt C 26.20 Gt C 32.75 Gt C 39.30 Gt C 45.85 Gt C 52.40 Gt C 58.95 Gt C 65.50 Gt C 72.05 Gt C 78.60 Gt C 85.15 Gt C 91.70 Gt C 98.25 Gt C 104.80 Gt C 111.35 Gt C 117.90 Gt C 124.45 Gt C 131.00 Gt C 137.55 Gt C 144.10 Gt C 150.65 Gt C 157.20 Gt C 163.75 Gt C 170.30 Gt C 176.85 Gt C 183.40 Gt C 189.95 Gt C 196.50 Gt C 203.05 Gt C %/a 100.0% 50.0% 33.3% 25.0% 20.0% 16.7% 14.3% 12.5% 11.1% 10.0% 9.1% 8.3% 7.7% 7.1% 6.7% 6.3% 5.9% 5.6% 5.3% 5.0% 4.8% 4.5% 4.3% 4.2% 4.0% 3.8% 3.7% 3.6% 3.4% 3.3% 2020 2021 2022 2023 2024 2025 2026 2027 2028 2029 2030 2031 2032 2033 2034 2035 2036 2037 2038 2039 2040 2041 2042 2043 2044 2045 2046 2047 2048 2049 2050
Step Two
From 1750 to 2000 the Airborne Fraction of CO2 emissions was almost 'Constant' (CAF) around 43%.
This CAF is also known as the Fraction Retained (43%) i.e. it is cumulative with the balance being
the Fraction Returned (57%) where again it is accumulative (~50:50) in the Land/Ocean Sinks for CO2.
As one Part Per Million by Volume of atmospheric CO2, in carbon weighs 2.13 billion tonnes (Gt C),
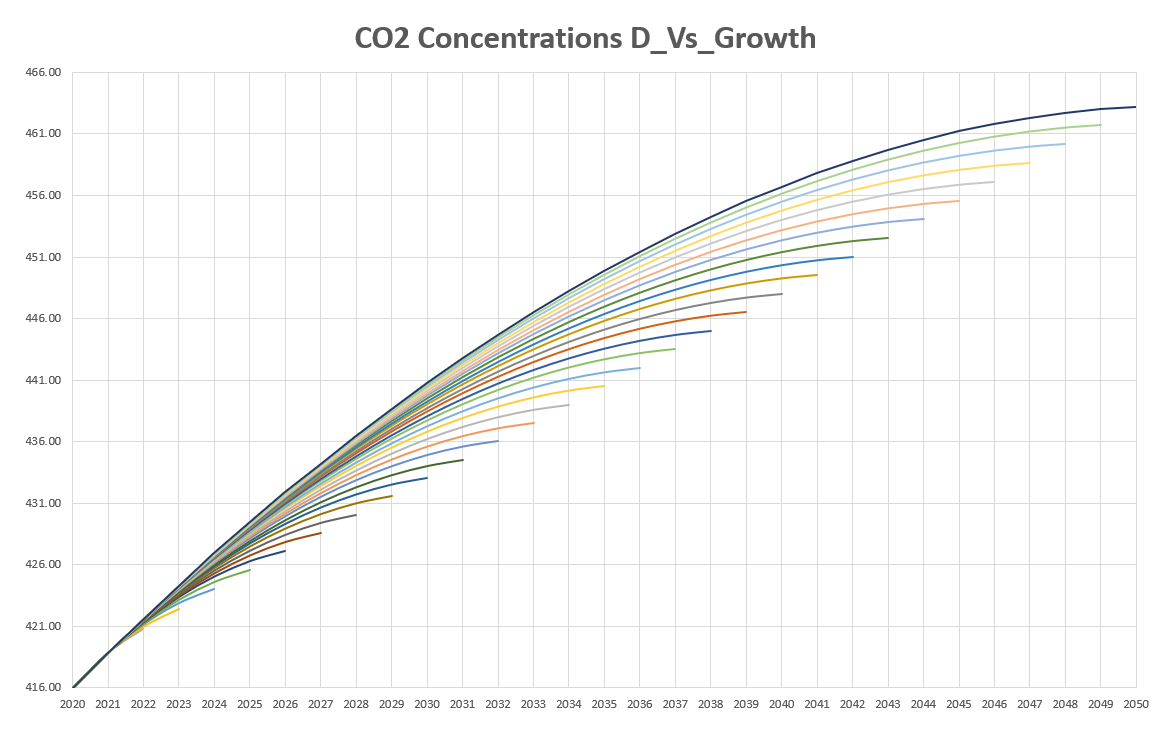
calculating weight-range of CO2 concentration deceleration curves (shown below) is consequent on the
carbon-emission contraction-integrals (shown above) between 2020 & 2050 (& reconverting to PPMV).
The whole purpose of doing this is to make clear this 'sink-function' or CO2 relationship and to plot any changes
in the relationship between CO2 Emissions to the atmosphere & accumulations of CO2 in the atmosphere.
Because comparing tonnes of emissions with tonnes of concentrations (in Gt C) is straightforward,
the 'sink-function' (like the plug hole in the bath) is now easily revealed as no longer constant.
The fraction-returned to the sinks is now at around 55% and this decrease results primarily from
the warming and acidfication of the oceans. In the analogy the plug hole is getting blocked.
The fraction-retained in the atmosphere is therefore now around 45% and is projected
to increase as sink-efficiency weakens further.
This has been included here as follows: -
The figures generated here from 2020 to 2050, show the rate of concentration rise
reflecting sinks weakening at 0.167% per annum. So in the projections shown here,
the Fraction Retained and the Fraction Returned are about 50:50 by 2050.
This is a reasonable estimate, in the face of multiple 'known-unknowns'.
However, the most important take-away here is that as CO2 emissions fall, CO2 concentration rise
merely slows. Emissions are like a tap flowing into a bath while concentrations are like the bath itself
while the the flow from the tap slows as emissions fall, the bath continues to rise albeit at a slower rate.
Here are the numbers that generate the chart above.
The rate of sink-weakening - or the slow decrease of the fraction returned versus the increase of the fraction retained - is in column one.
100% 2020 2021 2022 2023 2024 2025 2026 2027 2028 2029 2030 2031 2032 2033 2034 2035 2036 2037 2038 2039 2040 2041 2042 2043 2044 2045 2046 2047 2048 2049 2050 45.00% 2020 416.00 416.00 416.00 416.00 416.00 416.00 416.00 416.00 416.00 416.00 416.00 416.00 416.00 416.00 416.00 416.00 416.00 416.00 416.00 416.00 416.00 416.00 416.00 416.00 416.00 416.00 416.00 416.00 416.00 416.00 416.00 45.17% 2021 418.85 418.85 418.85 418.85 418.85 418.85 418.85 418.85 418.85 418.85 418.85 418.85 418.85 418.85 418.85 418.85 418.85 418.85 418.85 418.85 418.85 418.85 418.85 418.85 418.85 418.85 418.85 418.85 418.85 418.85 45.33% 2022 420.76 421.00 421.14 421.24 421.31 421.36 421.40 421.43 421.45 421.48 421.49 421.51 421.52 421.54 421.55 421.56 421.56 421.57 421.58 421.58 421.59 421.60 421.60 421.60 421.61 421.61 421.62 421.62 421.62 45.50% 2023 422.44 422.87 423.15 423.36 423.51 423.63 423.73 423.81 423.87 423.93 423.97 424.01 424.05 424.08 424.11 424.13 424.16 424.18 424.20 424.21 424.23 424.24 424.26 424.27 424.28 424.29 424.30 424.31 45.67% 2024 424.02 424.60 425.01 425.31 425.55 425.75 425.90 426.03 426.14 426.24 426.32 426.39 426.46 426.51 426.56 426.61 426.65 426.69 426.72 426.75 426.78 426.81 426.83 426.86 426.88 426.90 426.92 45.83% 2025 425.56 426.25 426.76 427.16 427.48 427.74 427.96 428.15 428.31 428.44 428.56 428.67 428.76 428.85 428.92 428.99 429.06 429.11 429.16 429.21 429.26 429.30 429.34 429.37 429.40 429.44 46.00% 2026 427.08 427.85 428.45 428.93 429.33 429.66 429.94 430.17 430.38 430.56 430.72 430.86 430.99 431.10 431.21 431.30 431.39 431.46 431.54 431.60 431.67 431.72 431.78 431.83 431.87 46.17% 2027 428.58 429.42 430.10 430.65 431.12 431.51 431.84 432.13 432.38 432.61 432.81 432.98 433.14 433.29 433.42 433.54 433.65 433.75 433.85 433.93 434.01 434.09 434.16 434.22 46.33% 2028 430.08 430.98 431.72 432.33 432.86 433.30 433.69 434.03 434.33 434.59 434.83 435.05 435.24 435.42 435.58 435.72 435.86 435.98 436.10 436.21 436.31 436.40 436.49 46.50% 2029 431.57 432.52 433.31 433.99 434.56 435.06 435.50 435.88 436.23 436.53 436.81 437.06 437.28 437.49 437.68 437.86 438.02 438.17 438.31 438.43 438.55 438.67 46.67% 2030 433.06 434.05 434.89 435.61 436.24 436.79 437.27 437.70 438.08 438.43 438.74 439.03 439.29 439.52 439.74 439.94 440.13 440.31 440.47 440.62 440.76 46.83% 2031 434.54 435.57 436.46 437.23 437.90 438.49 439.01 439.48 439.91 440.29 440.64 440.96 441.25 441.52 441.76 441.99 442.21 442.40 442.59 442.76 47.00% 2032 436.03 437.10 438.02 438.82 439.54 440.17 440.73 441.24 441.70 442.12 442.51 442.86 443.18 443.48 443.75 444.01 444.25 444.47 444.68 47.17% 2033 437.52 438.61 439.57 440.41 441.16 441.83 442.43 442.98 443.48 443.93 444.35 444.73 445.08 445.41 445.71 445.99 446.26 446.50 47.33% 2034 439.01 440.13 441.11 441.99 442.78 443.48 444.12 444.70 445.23 445.72 446.16 446.58 446.96 447.31 447.64 447.95 448.24 47.50% 2035 440.50 441.64 442.66 443.56 444.38 445.12 445.79 446.40 446.97 447.48 447.96 448.40 448.81 449.19 449.55 449.88 47.67% 2036 442.00 443.16 444.20 445.13 445.98 446.75 447.45 448.10 448.69 449.23 449.74 450.21 450.65 451.06 451.44 47.83% 2037 443.50 444.68 445.74 446.70 447.57 448.37 449.10 449.77 450.40 450.97 451.51 452.00 452.47 452.90 48.00% 2038 444.99 446.19 447.28 448.26 449.16 449.99 450.75 451.45 452.09 452.70 453.26 453.78 454.27 48.17% 2039 446.50 447.71 448.82 449.82 450.75 451.60 452.38 453.11 453.78 454.41 455.00 455.55 48.33% 2040 448.00 449.23 450.35 451.38 452.33 453.20 454.01 454.76 455.46 456.12 456.73 48.50% 2041 449.51 450.75 451.89 452.94 453.91 454.81 455.64 456.41 457.14 457.81 48.67% 2042 451.02 452.28 453.43 454.50 455.49 456.41 457.26 458.06 458.81 48.83% 2043 452.53 453.80 454.98 456.06 457.07 458.01 458.88 459.70 49.00% 2044 454.05 455.33 456.52 457.62 458.65 459.60 460.50 49.17% 2045 455.57 456.86 458.06 459.18 460.23 461.20 49.33% 2046 457.10 458.40 459.61 460.74 461.80 49.50% 2047 458.62 459.94 461.16 462.31 49.67% 2048 460.15 461.48 462.71 49.83% 2049 461.69 463.02 50.00% 2050 463.22 Step Three
The relationship of atmospheric CO2 concentrations to temperature.
Due to multiple known-unknowns & disagreements, measuring this
is not as straightforward as emissions to concentrations.
However, here is defendably straightforward way of dealing handling this.
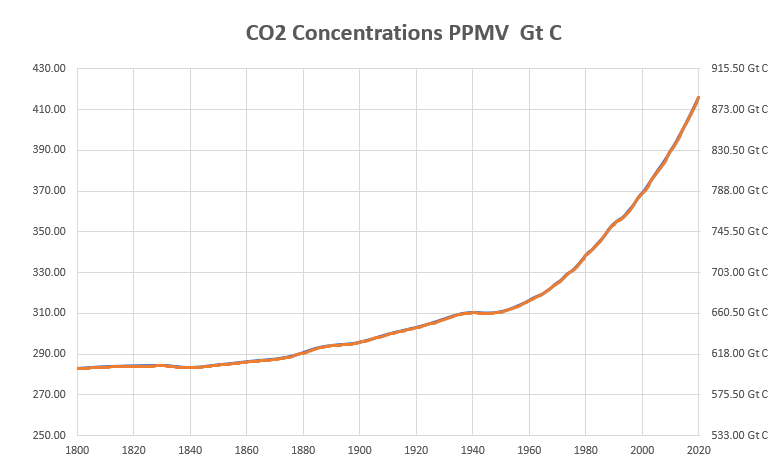
In 1750 average concentration of atmospheric CO2 was around 280 Parts Per Million by Volume (PPMV) or 594.4 GtC.
In 2020 average concentration of atmospheric CO2 was around 417 PPMV or 882.2 Gt C.
If 280 PPMV in 1750 is taken as 100%, 560 PPMV or 1192.8 Gt C at some hypothetical future point is 200%.
The 417 PPMV recorded now in 2020 has ocurred on accelerating curve to 149% . . .
'Climate Sensitivity' is a temperature measurement, guaged as a response to a doubling of CO2 concentrations.
CO2 doubling is 560 PPMV. In 2015 IPCC noted a range of 'climate sensitivity' estimates between 1.5° to 4.5° C.
Described as a 'consensus of contraversies' they noted that, "No best estimate for equilibrium climate sensitivity
can now be given because of a lack of agreement on values across assessed lines of evidence and studies."The purpose of this animation is primarily strategy/policy in the light of UNFCCC-Compliance requirements of
its objective of stabilisation and its principles of precaution & equity.
So the GISS data 1880 to 2020 (cited above) is used in the following way: -
Global average CO2 concentrations in 1960 was 310 PPMV as shown
Global average temperature in 1960 was + 0.2° C.
Global average CO2 concentrations in 2020 was 417 PPMV as shown.
Global average temperature in 2020 was + 1.2° C.
In other words, as a simple basis of projecting all these vectors forward until 2050,
these curves for PPMV & T° 1960 to 2020 are shown as the same curve.
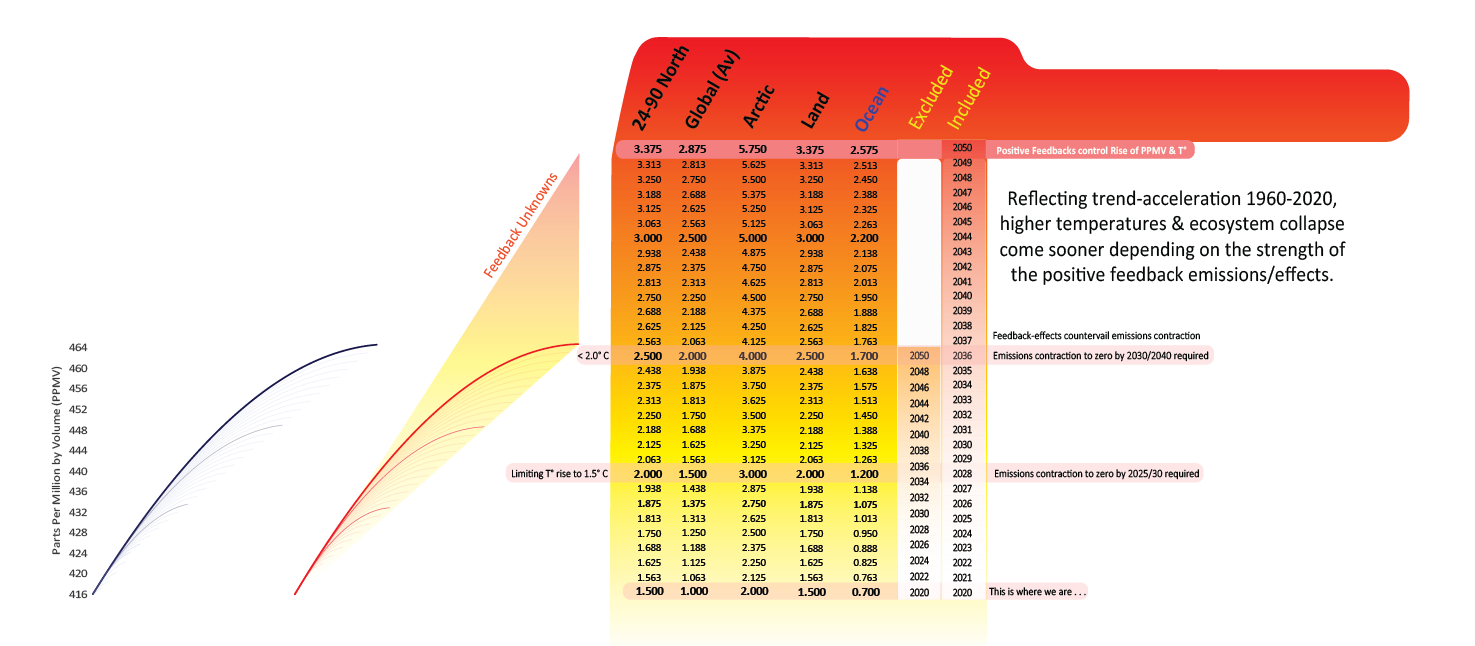
Following the GISS data for land average temperature to 2020 shows 1.5° C.
Following the GISS data for ocean average temperature to 2020 shows 0.7° C.
& it is generally accepted that average temperature in the Arctic has been rising
at at least twice the rate of the global average from 1960, thus showing 2.0° C in 2020.
Also there is the reality of 'feedback'. The UKMO which dominated preparations for IPCC AR5
in 2015 claimed all feedbacks were in the HADcrut 4.2 model. This was not true.
While the sign of the feedbacks is now seen to be more positive than negative, the rates at which
this shift is accelerating is unknowable so it is not possible to predict the rate of this acceleration.
Allowing for this 'known-unknown', the feedback-reality is measured in the following way: -
Global Average Temperature Rise without feedbacks 2020 to 2050 is 1.00° C to 2.00° C and
Global Average Temperature Rise with feedbacks 2020 to 2050 is 1.00° C to 2.87° C
Sticking to the differentials shown by GISS in the chart above, temperatures for Land,
Ocean and Arctic Temperature rise 2020 to 2050 are measured proportionate to that.
For that reason the judgement is made that zero emissions globally needs to complete by 2040 or sooner,
as the risks of runaway rates of climate change from zeroing emissions globally later than 2040 are too high.
Step Four
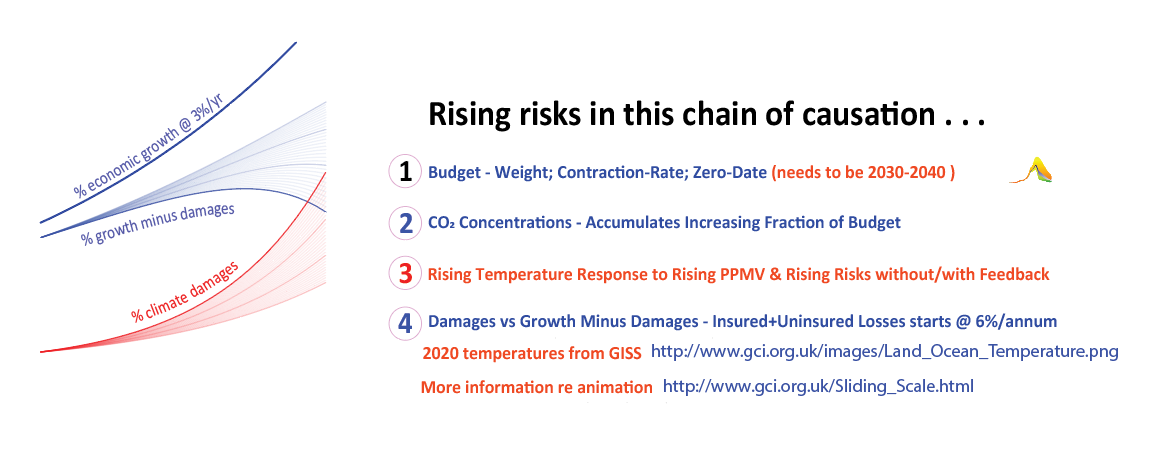
The relationship between Global Economic Growth and Climate Caused Damages.
Global Economic Growth is shown at a constant in crease rate of 3%/annum.
Climate Caused Damages are a combination of insured losses at 3%/annum plus
uninsured losses rising at a constant rate of 3%/annum as calculated by Munich Re in 2000.
Twenty years on in 2020 it is already clear that
- annual output emissions are now twice as high
- concentrations are accelerating upwards driving
- temperature rise into an upward acceleration causing
- damages both insured and uninsured into record-rates of increase
Subtracting climate damage-rates from economic growth-rates
consistent with slower-heavier emission-contraction-rates shows that: -
- when subtracted from the growth-rate
- the climate-damage-rate overtakes
- the growth-rate minus the damage-rate and that . . . .
in other words the global economy gradually collapses.
After 30 years the central problem remains 'measuring' the accelerating rates of change that are the result of both knowns & unknowns,
& doing this in a policy-relevant manner for a global strategy of UNFCCC-Compliance.
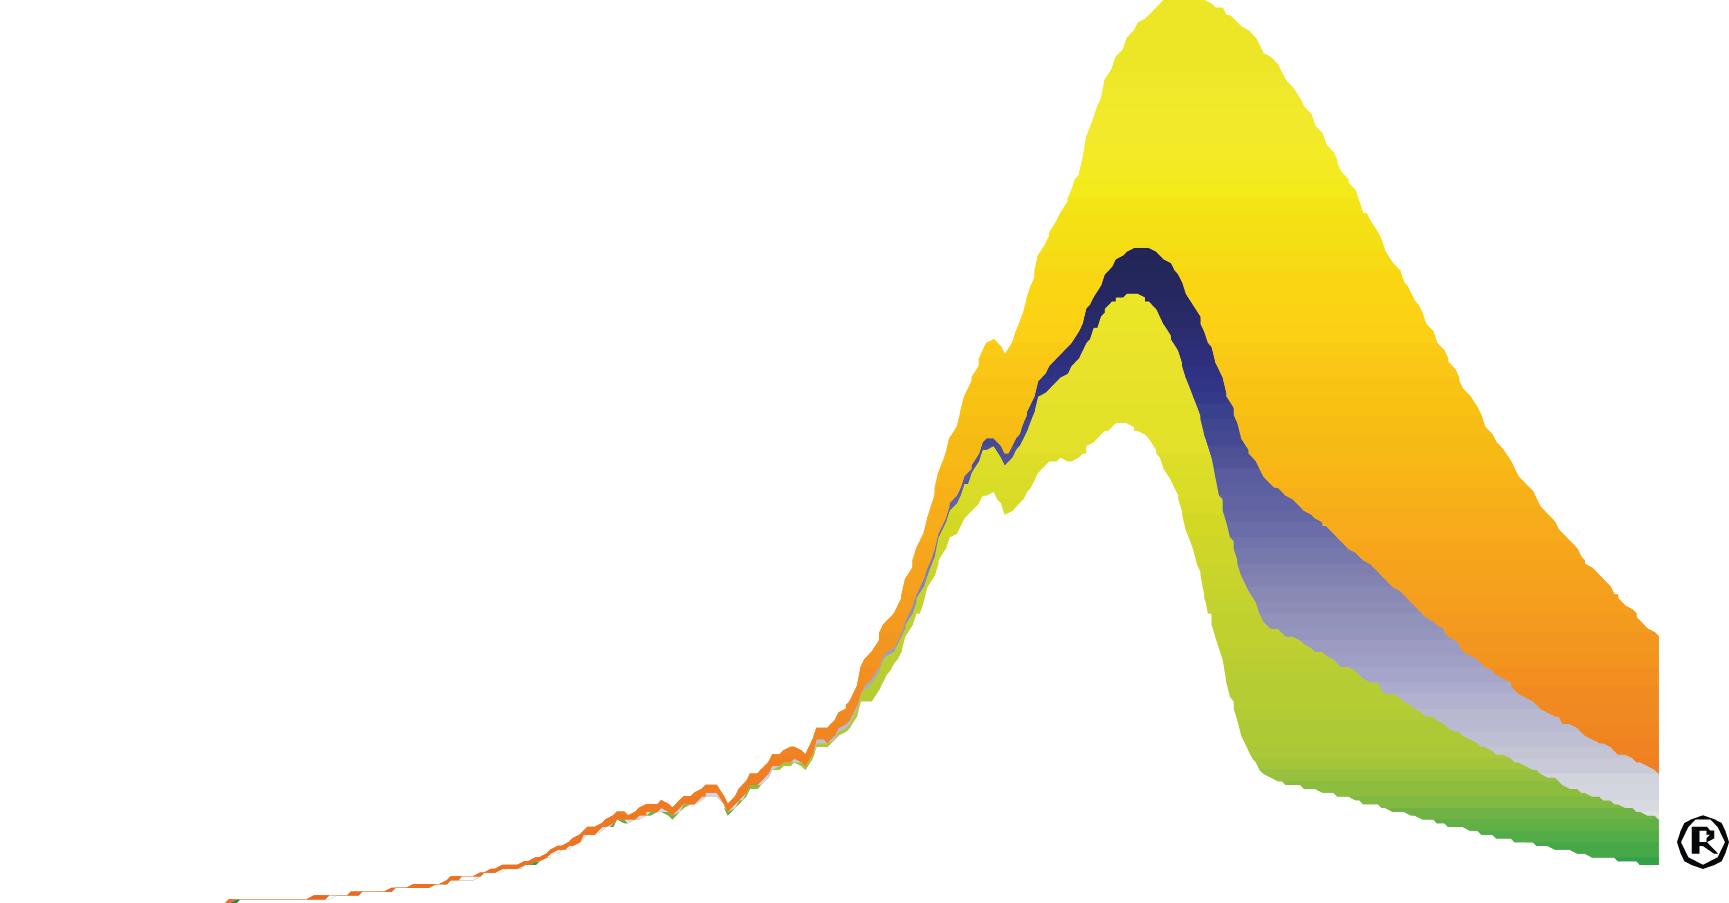
Here is a heuristic showing renewables replacing zero emissions globally by 2040 facilitated by the Rajan Tax Proposal
