- Explanation of the approach to historic emissions and division of the carbon budget
- The global carbon budget
- The country carbon budget chart
- The individual elements of the carbon budget chart
a) budget boxes; global totals & country shares
b) per capita country emissions over time
c) gross country emissions over time
d) share calculation methodology
e) easy visualization of CREDIT:DEBITNotes on budget boxes; global totals and country shares
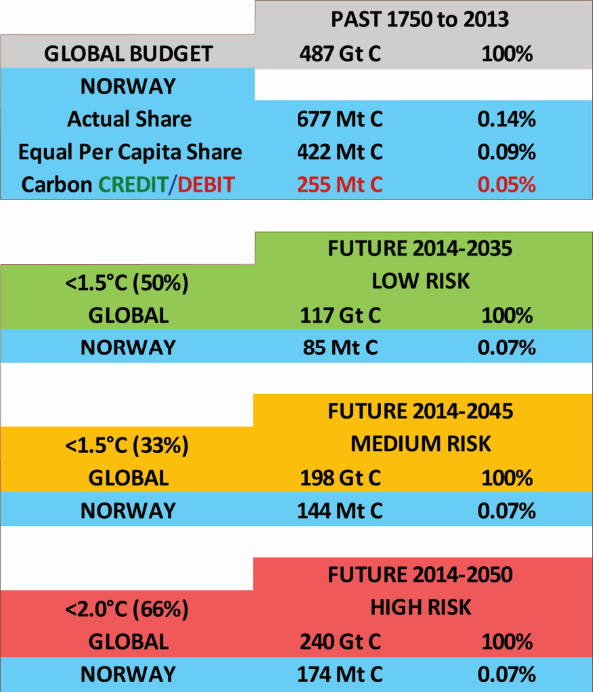
These boxes correlate with the global with the country-specific graphics.The top box contains historic carbon emissions from 1750-2013 (referred to as ‘global budget’22). The grey part contains the global total i.e. 487 Gt C (to convert this into CO2, multiply by 3.664, i.e. 1,784 Gt CO2).
Measured in tonnes of carbon the blue part of the top box contains the featured country’s shares of historic emissions, expressed as: -
- ACTUAL SHARE: the country’s actual historic emissions are expressed in tonnes of carbon and as a percentage of the total. Norway, for example, emitted 677.0 Mt C over this period (1750-2013), representing 0.14% of historic global emissions;
- EQUAL PER CAPITA SHARE: the country’s ‘share’ of historic emissions are also expressed in tonnes of carbon and as a percentage.
- Carbon DEBIT (on the country chart in RED): this is the difference between a country’s equal per capita share and the amount by which its actual share was more than this. Norway’s ‘carbon debit’ over this period (1750-20130) was 677 Mt C minus 422 Mt C, showing an ‘excess’ or ‘carbon debit’ of 255 Mt C, representing 0.05% of historic global emissions;
- Carbon CREDIT (on the country chart in GREEN) is the difference between a country’s equal per capita share and the amount by which its actual share was less than this. Overall 1750-2013, Norway had no ‘credit’, though it did dip below the global per capita average during WWII (shown in green).
The lower boxes reflect the traffic-light coding of Carbon Budgets 1-3, and correspond to the future budgets represented by the dotted curves on the right-hand side of the charts. The top parts of these boxes express the global total mass of carbon remaining for each of the Budgets. The lower part shows the country’s share on the basis of equal per capita emissions, expressed as a percentage of global population (in Norway’s case, 0.07%).
We recognize that ‘budget’ is a potentially confusing term in this context, since it refers only to actual historic emissions, rather than a pre-determined allocation. We have used it simply to correspond to the concept of the country ‘shares’ of historic emissions, which, in turn, provide the basis for the assessment of credit and debit.