GLOBAL CO2 Emissions from Fossil Fuel Burning & Land Use Changes
All country Accumulated International CREDITS &/or DEBITS 1750 to 2013....
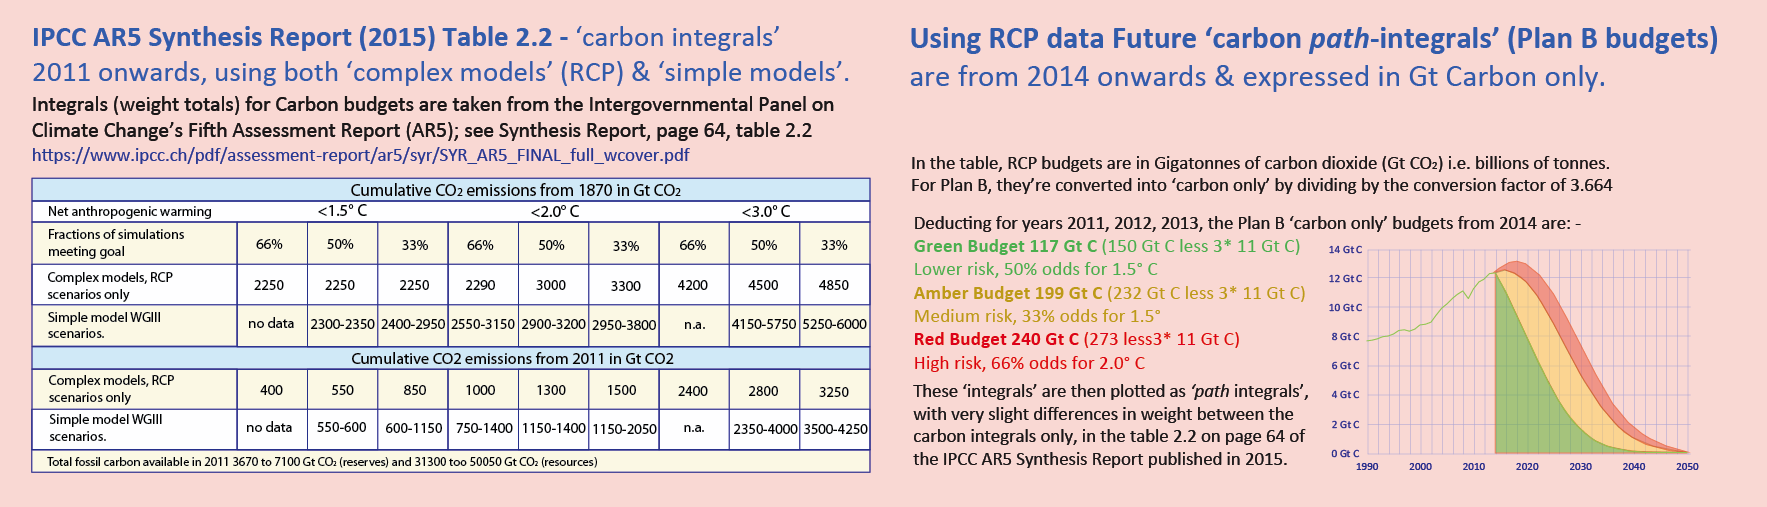
& Future global carbon constraints set by the Paris Agreement to the UNFCCC
In 2017, we are approaching the 'event horizon' of irreversibility with climate change. In December 2017, Jeremy Mathis, Director of NOAA's Arctic Programme said,
"the environment is changing so quickly . . . there is an almost runaway effect . . . we can't quite get a handle on what this new state is going to look like."
However, the UK Government refuses to align its carbon reduction target with the Paris Climate Agreement
*************************************************************************
![]()
- C&C first 20 years (1989-2008)
- Assumptions; the 'Well Tempered Climate Accord'
- C&C principle is unchallenged
- The principle is 'Well Tempering'
- Support for this remains unrivalled
- More High Level Support
- The C&C Archive
- Global Warming is Accelerating (positive-feedback)
- Sinks are shrinking (positive-feedback)
- Feedback & C&C Embedded in CBAT the Carbon Budget Analysis Tool
- The UK Climate Act (UKCA 2008) is C&C (Right Principle, Wrong Rates)
- All UK Political Parties strongly endorsed C&C
- EAC Carbon Budget Enquiries (2009 - 2013)
- Emissions Creep since UKCA
- 'Five Wise Monkeys' - a ludicrous idea from the UK CCC
- Sane Safe Fair? UK 'leadership' is >3 times its global share!
- More false accounting from the British Government
- Fee and Dividend - a good idea from James Hansen
- Collaboration with Plan-B
- All Country CREDIT DEBIT (1750-2020)
- Submission to the Talanoa Dialogue (2017)
- Damages Liabilities
- Judicial Review
- The irrationality of delay; the case in a Nutshell
- Judicial Review; Update
- Speech at RCJ; C&C "The Well Tempered Climate Accord"
- Judicial Review; Second Update
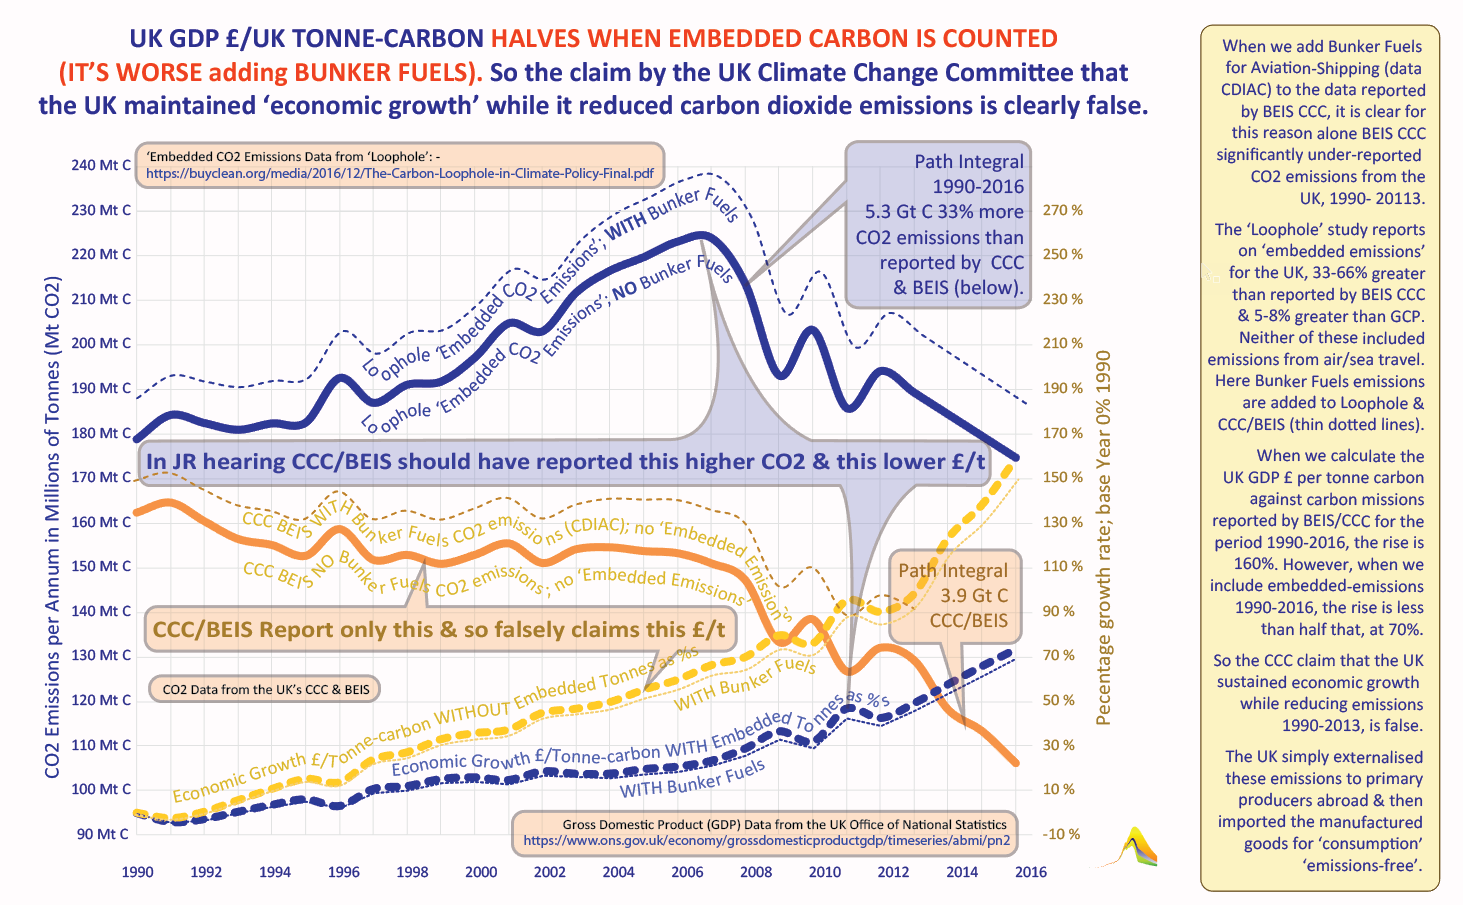
- HMG dodgy statistics
- IPCC 'Miracle' for AR6 - more carbon equals less temperature
- Climate emergency, COP-24 & the the 'Katowice Rulebook'
- 'Dominance' (Music) - the 'seminal derivation' of 'Phi'
- Phi All Life
- Eternity
- A Beautiful Model (Limits to Growth)
*************************************************************************
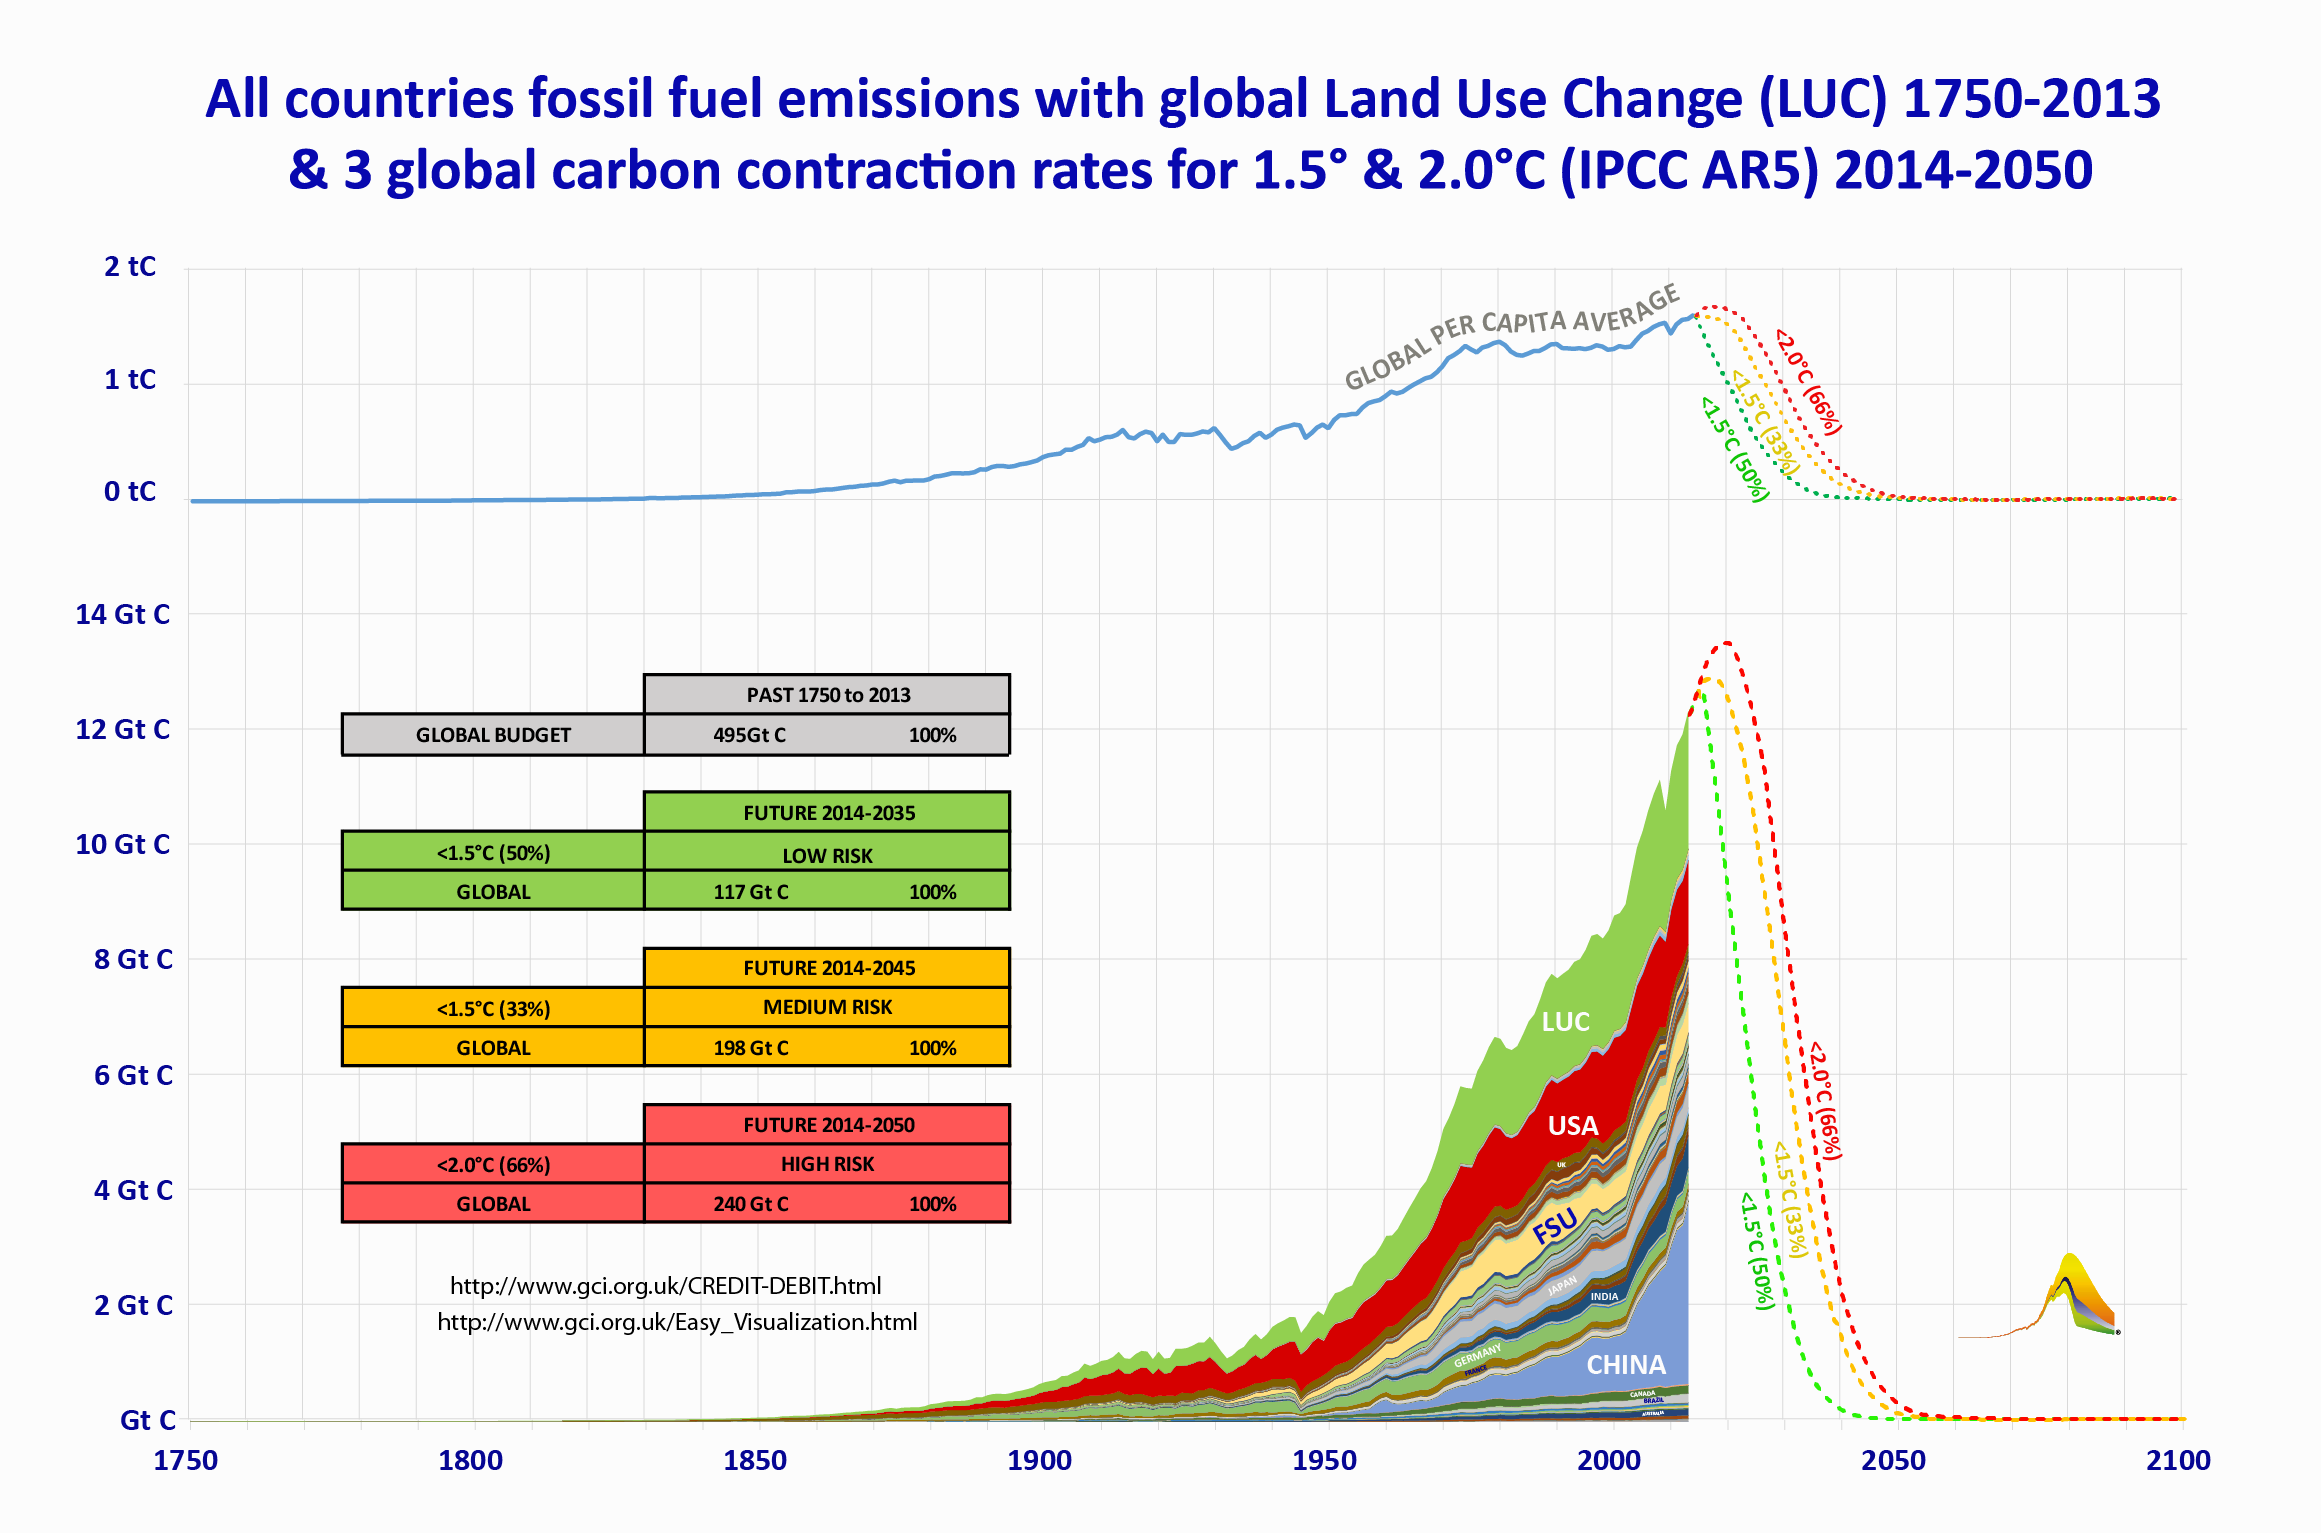
From 1750 to 2013 & forward to 2050, by country & at each point in time (by year), carbon-shares are calculated in relation to the global per capita average amount of emissions in each of those years. This defines the international per capita average of carbon consumption as a global reference standard over that time. Here is consumption by resource 1750 to 2013
The extent of carbon CREDIT and/or DEBIT internationally accumulated since 1750 is recorded in the country charts and tables at the regional links here: -
ASIA AFRICA AMERICA EUROPE OCEANIA
From this global reference standard, we can quantify and compare international carbon consumption per unit time over: -
- the 'PAST', a period of gradual emissions expansion (with ~50% accumulation in the global atmosphere & 25% accumulation in the global sinks) &
- the 'FUTURE', a period of rapid emissions contraction and what needs to happen 2014-2050 for UNFCCC-compliance, as per the Paris Agreement (see below).
- So with the national parts commuting with the international whole across time and space, if an individual country's actual emissions: -
- were above that average,
the country as a whole was debiting the global commons account,
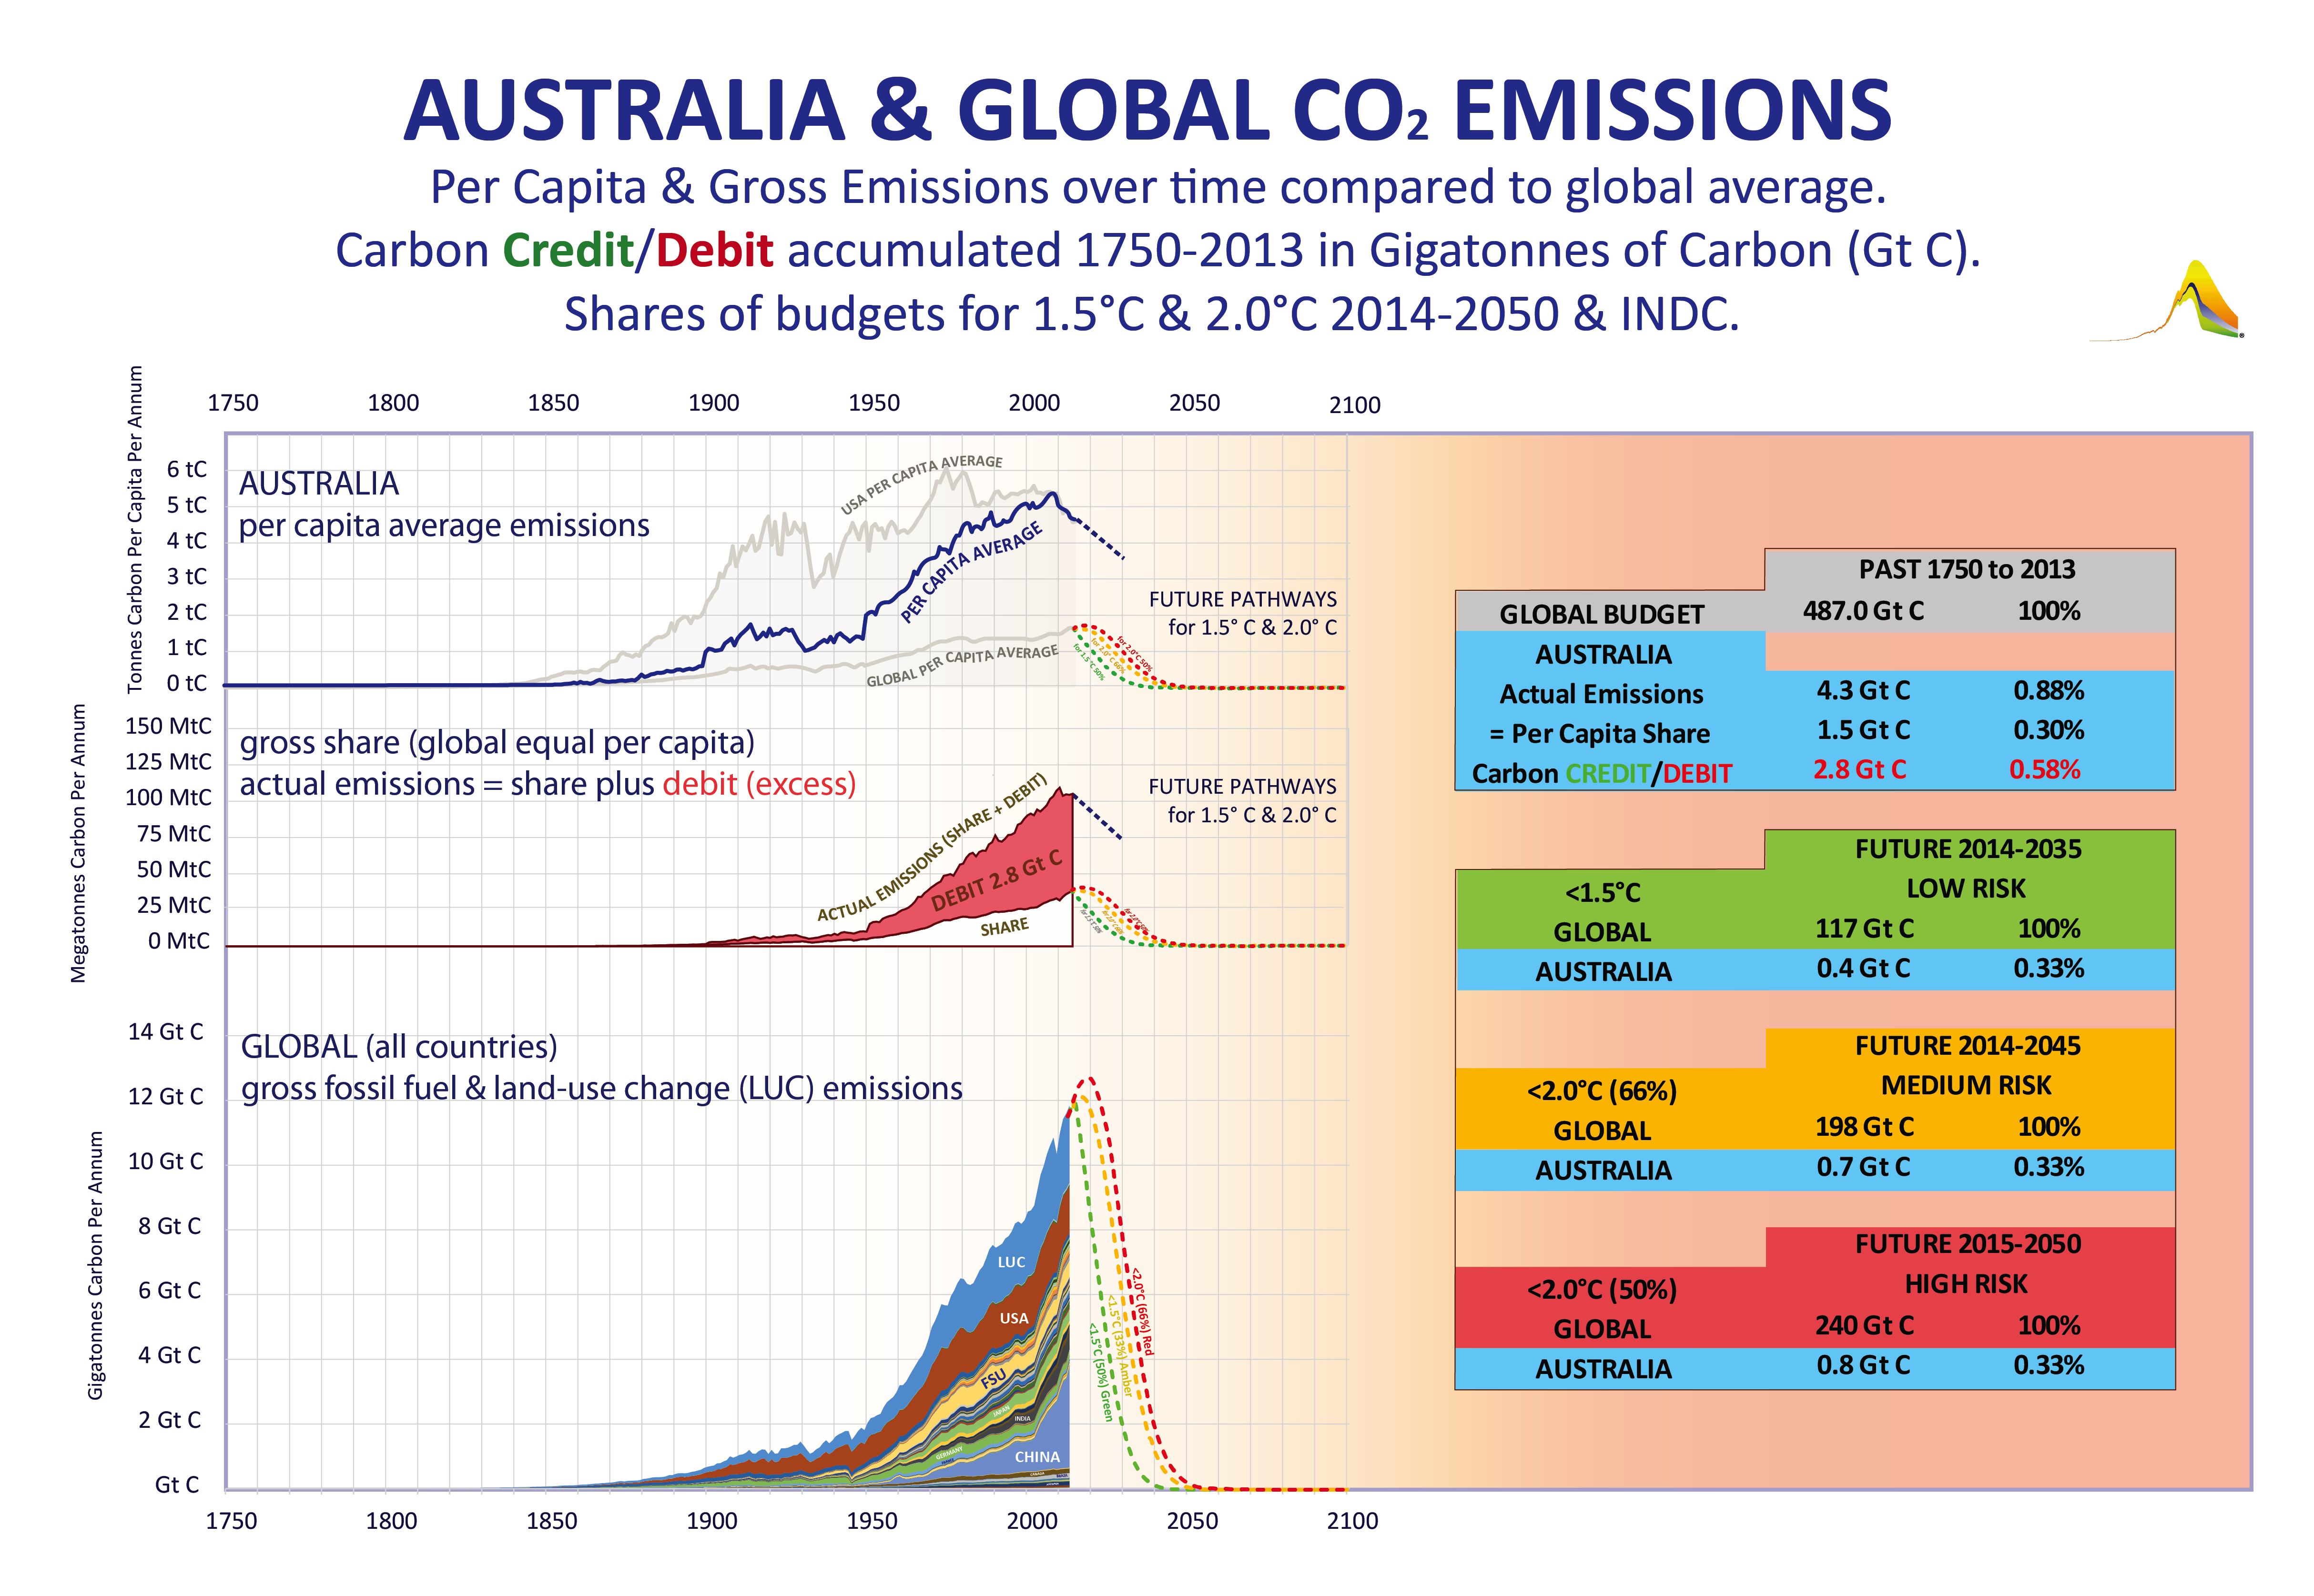
with the country's gross emissions integral (1750-2013) being shown, as here e.g. Australia
- were below that average,
the country as a whole was crediting the global commons account,
with the country's gross emissions integral (1750-2013) being shown, as here e.g. Papua New Guinea
- were both above and below that average,
the country as a whole was both crediting and debiting the global commons account,
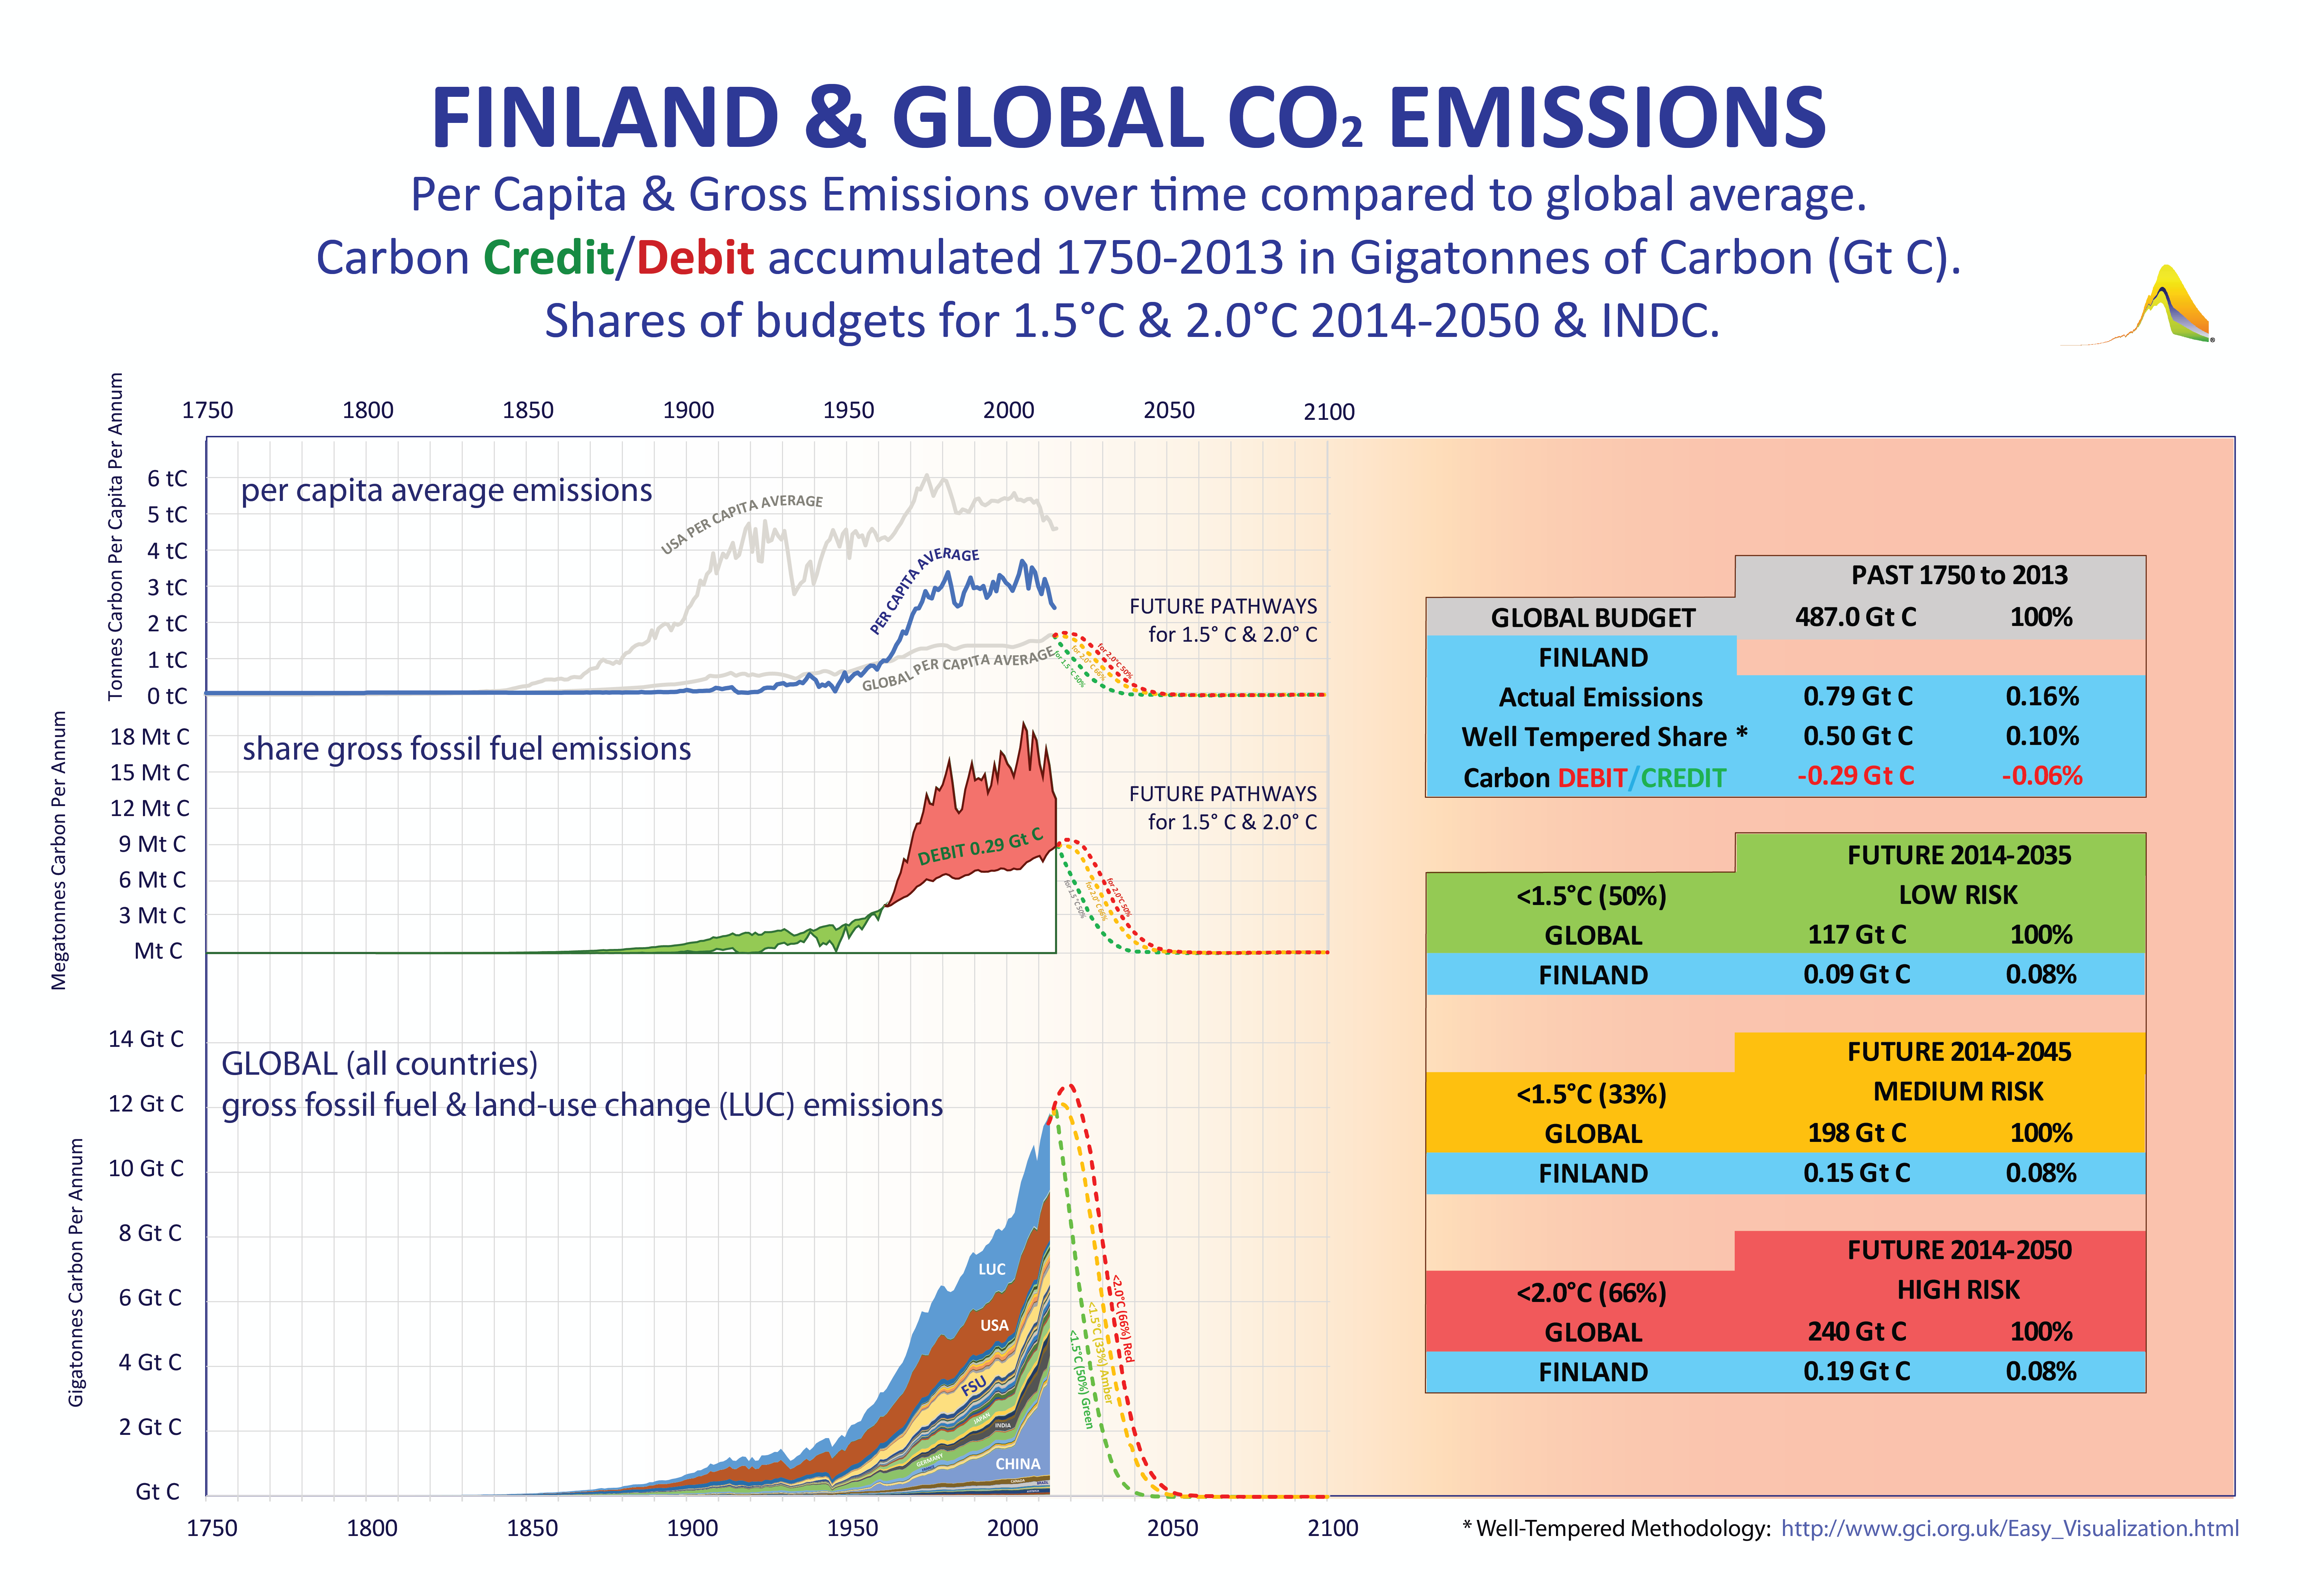
with the country's gross emissions integral (1750-2013) being shown, as here e.g. Finland
Here is an Easy Visualization summarising how & why CREDIT:DEBIT is calculated this way
Here is a Simple Basis for internationally sharing accumulated Joint-Several Liability for climate loss-&-damages claims arising at this time
- were above that average,
the country as a whole was debiting the global commons account,
Past emissions data comes primarily from CDIAC (Carbon Dioxide Information Analysis Centre - US Government);
Population data comes from various sources (principally from the World Bank);
Future carbon budget integrals to meet the temperature targets in the 'Paris Agreement' come from the IPCC AR5 Synthesis Report.
A short explantation of each element of the global analysis that has been done for each country
With some overall analysis of CO2 flows 1750-2050, the 209 countries in this study are listed here
*************************************************************************
- All Country CREDIT DEBIT (1750-2020)
- C&C first 20 years (1989-2008)
- UK Climate Act (2008)
- C&C principle is unchallenged; support for it is unrivalled
- C&C is Embedded in 'CBAT', the Carbon Budget Analysis Tool
- Global Warming is Accelerating
- Sinks shrinking
- EAC Carbon Budget Enquiries (2009 - 2013)
- Collaboration with Plan-B
- Submission to the Talanoa Dialogue (2017)
- Damages Liabilities
- Judicial Review
- The irrationality of delay - the case in a Nutshell
- Judicial Review - Update
- Speech at RCJ - C&C, "The Well Tempered Climate Accord"
- Judicial Review - Second Update
- HMG dodgy statistics
- Sane Safe Fair (UK CO2 'leadership' is >3 times its equal global share)
- IPCC Miracle for AR6 - more carbon equals less temperature
- Assumptions (logic versus ideology)
- 'Dominance' (Music) - the 'seminal derivation' of 'Phi'
- Phi All Life
- Eternity
- A Beautiful Model (Limits to Growth)